Fig. 2
Download original image
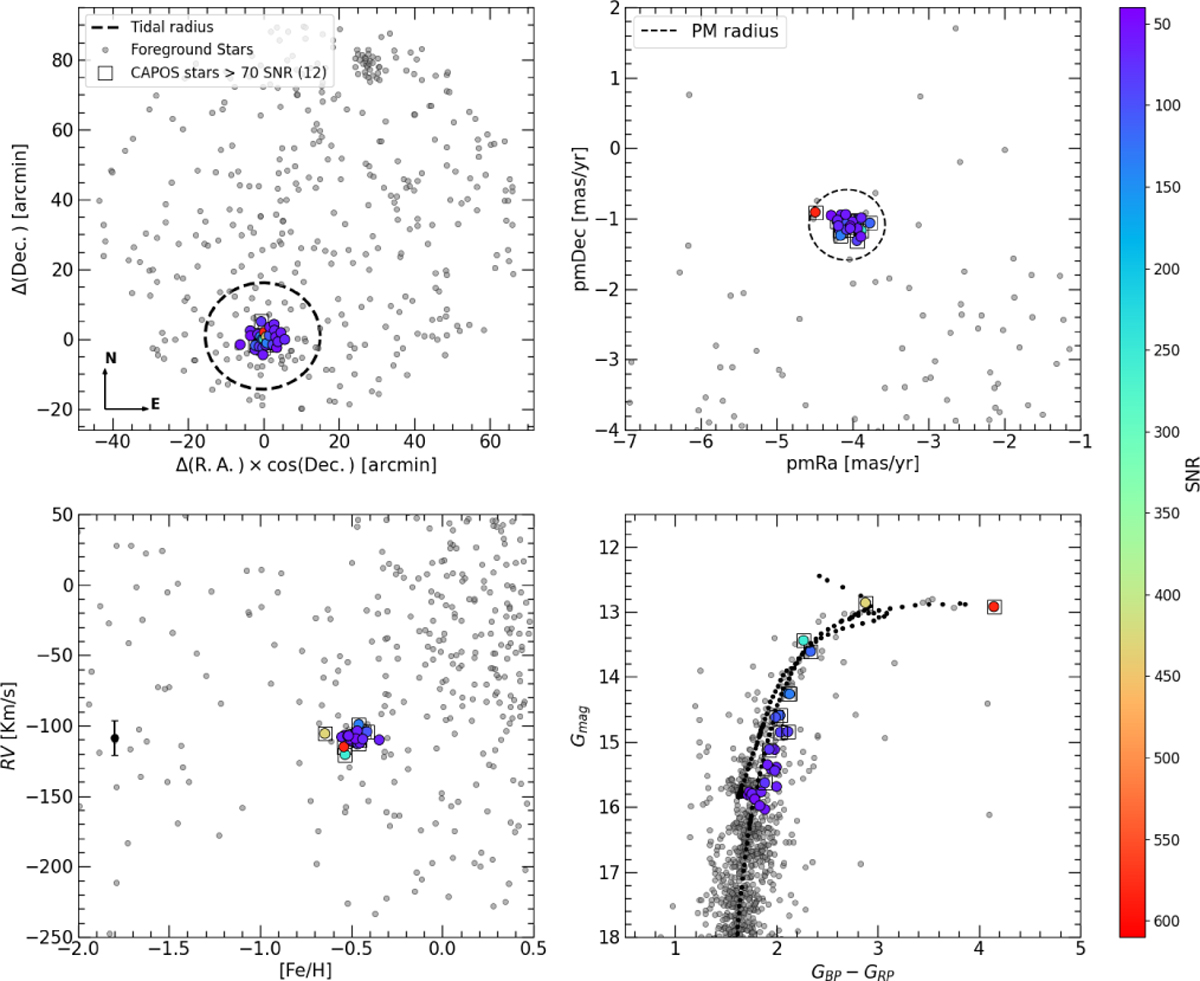
Selection of NGC 6304 membership. Top left: spatial distribution of observed stars within the APOGEE-2 survey area. The dashed black circumference indicates the tidal radius of the cluster (tr=15.25′). NGC 6316 can be seen to the NE. Top right: PM distribution of the stars within the tidal radius obtained from Gaia DR3. The dashed circumference has a radius of 0.5 [mas/yr]. Bottom left: selection in the RV vs. [Fe/H] plane from ASPCAP for the candidate members. The point with error bars shows the mean RV and its standard deviation from the Baumgardt et al. (2023) database. Bottom right: G vs. (Gbp − Grp) CMD. Final selected members are shown in all plots as points color-coded according to their S/N, while the field stars are represented as gray dots. The plotted isochrone of 12 Gyr represents the best PARSEC fit. Black squares in the plots are those stars with S/N > 70.
Current usage metrics show cumulative count of Article Views (full-text article views including HTML views, PDF and ePub downloads, according to the available data) and Abstracts Views on Vision4Press platform.
Data correspond to usage on the plateform after 2015. The current usage metrics is available 48-96 hours after online publication and is updated daily on week days.
Initial download of the metrics may take a while.