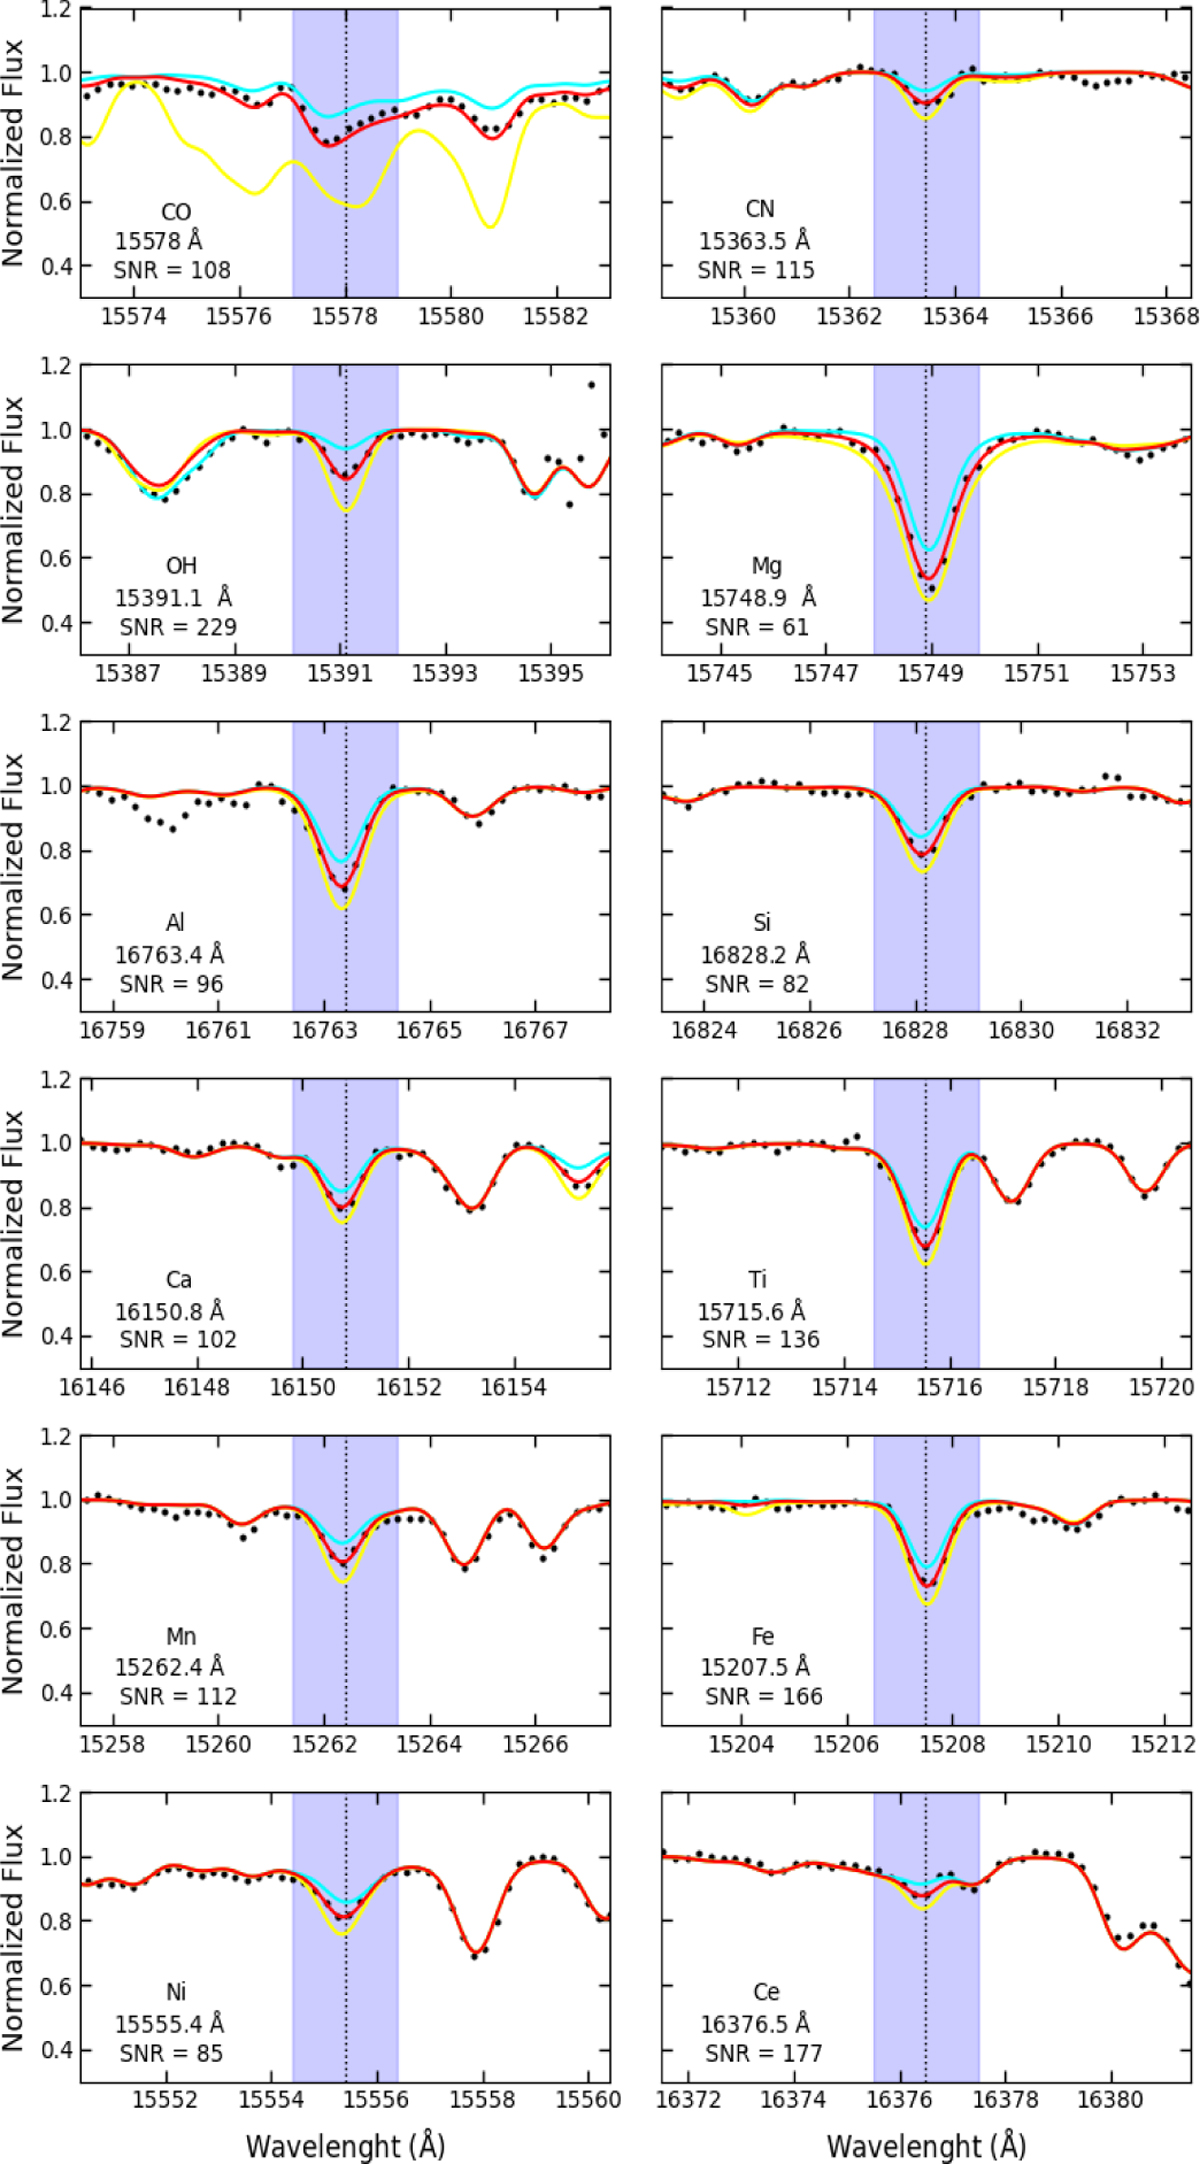
Fig. 4
Download original image
Quality of the model fit obtained with BACCHUS around the molecular lines (12C16O, 12C14N, and 16OH) and atomic lines (Mg, Al, Si, Ca, Ti, Mn, Fe, Ni, and Ce) for the star 2M17143117-2930149 (S/N = 88). The dotted black line represents the observed spectrum, while the solid colored lines correspond to synthetic spectra with abundances varying by ±0.3 dex, except for Mg, Al, Si, Ti, and Fe, whose abundances vary by ±0.5 dex. The best-fitting synthetic spectrum is shown in red. Each panel is centered on the selected lines with the dashed black lines indicating the positions of the air wavelength lines.
Current usage metrics show cumulative count of Article Views (full-text article views including HTML views, PDF and ePub downloads, according to the available data) and Abstracts Views on Vision4Press platform.
Data correspond to usage on the plateform after 2015. The current usage metrics is available 48-96 hours after online publication and is updated daily on week days.
Initial download of the metrics may take a while.