Fig. 5
Download original image
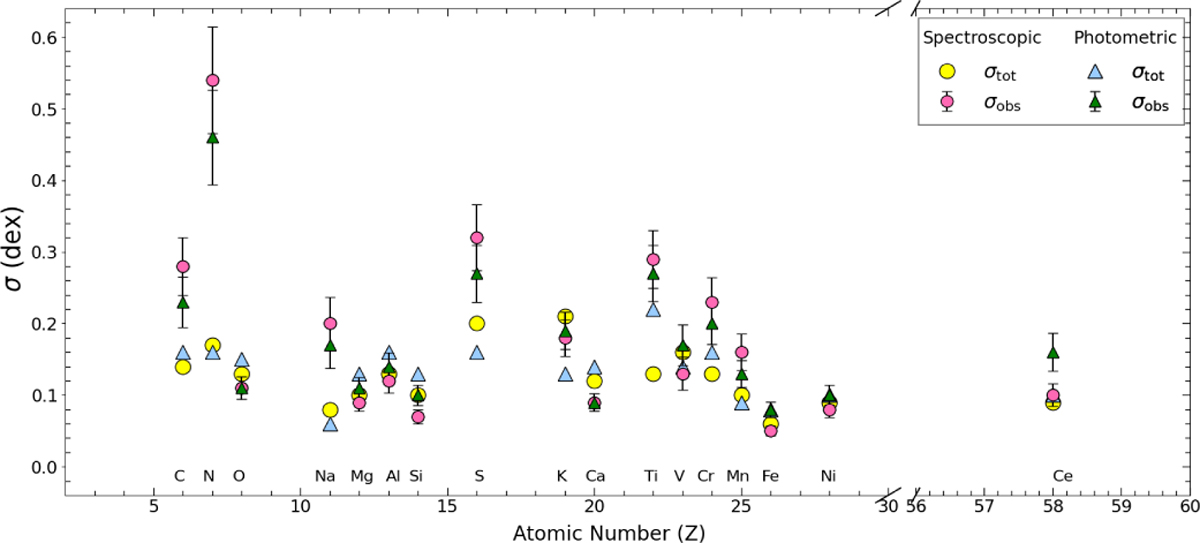
Comparison between σtot and σobs as a function of the atomic number (Z). Total error of our measurements and the observed error derived from BACCHUS using spectroscopic stellar parameters are represented by yellow and pink circles, respectively, while those obtained using photometric parameters are shown as blue and green triangles. Error bars indicate the error of the mean. Element abbreviations are shown for clarity.
Current usage metrics show cumulative count of Article Views (full-text article views including HTML views, PDF and ePub downloads, according to the available data) and Abstracts Views on Vision4Press platform.
Data correspond to usage on the plateform after 2015. The current usage metrics is available 48-96 hours after online publication and is updated daily on week days.
Initial download of the metrics may take a while.