Fig. F.1
Download original image
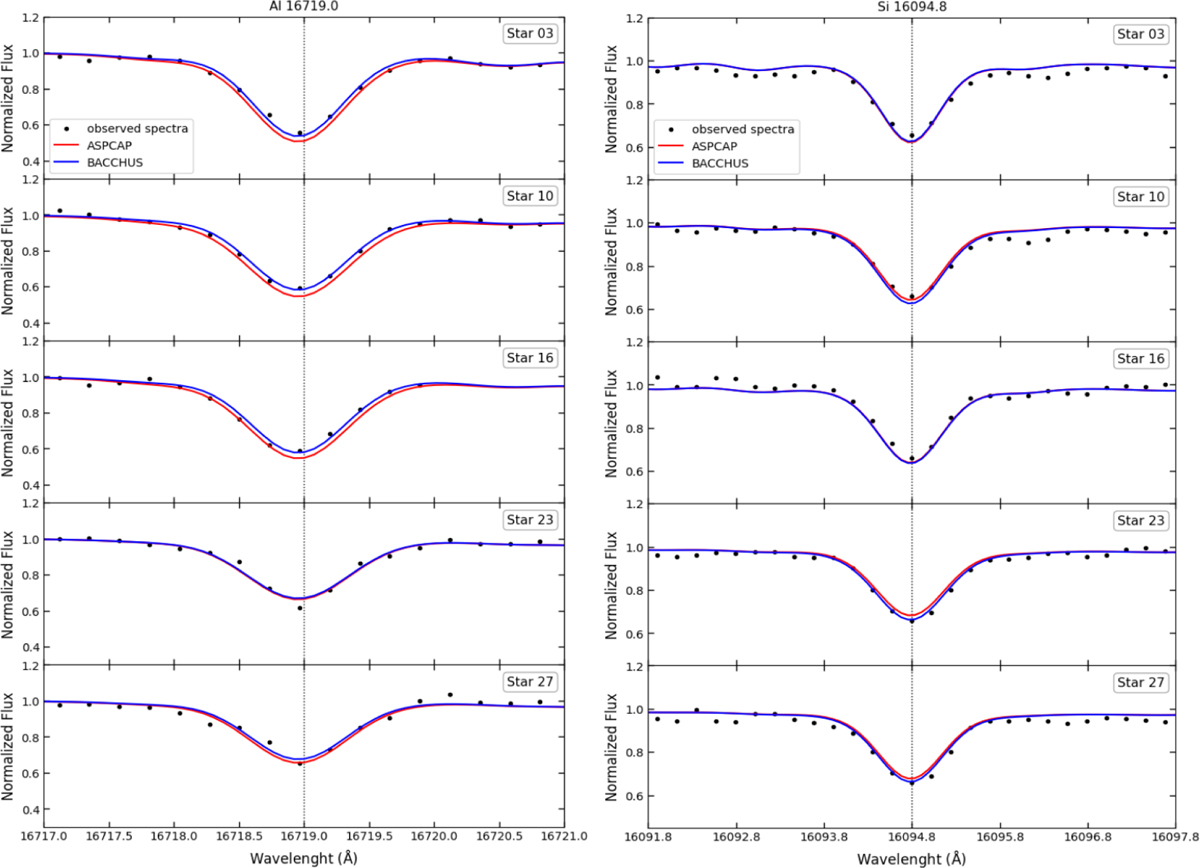
Comparison between the observed APOGEE spectra (black dots) and synthetic spectra computed with BACCHUS using two different abundances for five representative stars in NGC 6304. The red lines correspond to synthetic spectra generated with the log(Si I) (or log(Al I)) abundance derived by ASPCAP, while the blue lines correspond to spectra computed using the BACCHUS abundance for the same element. The left panel shows Al I 16719.0 Å, and the right panel shows Si I 16094.8 Å. In most cases, the BACCHUS abundance results in a slightly better fit to the observed line profile, taking into account that both synthetic spectra were computed with the same radiative transfer code (Turbospectrum) and line list.
Current usage metrics show cumulative count of Article Views (full-text article views including HTML views, PDF and ePub downloads, according to the available data) and Abstracts Views on Vision4Press platform.
Data correspond to usage on the plateform after 2015. The current usage metrics is available 48-96 hours after online publication and is updated daily on week days.
Initial download of the metrics may take a while.