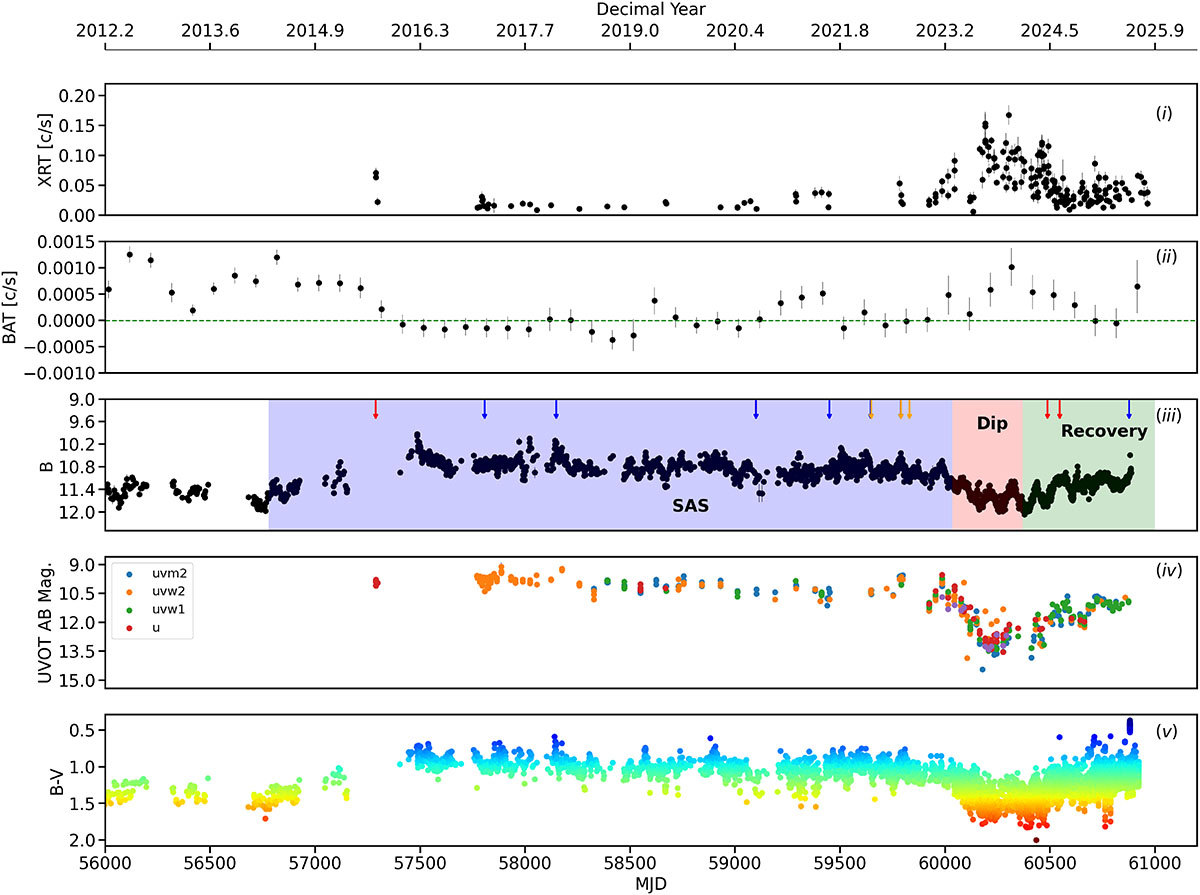
Fig. 1.
Download original image
Long-term, multiwavelength light curves of T CrB since March, 2012 until August 2025. From top to bottom: (i) Swift/XRT light curve in the 0.3–10 keV energy range; (ii) Swift/BAT 14–50 keV light curve with 100-day bins. (iii) AAVSO B-band light curve (Johnson magnitudes). Downward arrows mark the dates of the XMM-Newton (blue), HST (orange), and NuSTAR (red) observations. Note: Because some XMM-Newton and HST observations were quasi-simultaneous, their marks overlap in this panel and we only mark the dates of those HST observations flagged as Good in Table 1. The purple-shadowed region comprises the period known as the SAS, while the pink-shaded region marks the period when the optical/UV brightness dropped to pre-SAS levels, known as the dip, and the green-shadowed region shows the period that started around late 2023 when the brightness in optical/UV has started to rise again in the recovery phase; (iv) Swift/UVOT light curve in the uvm2, uvw2, uvw1, u filters; (v) AAVSO B − V color, where red indicates a redder, cooler emission, while blue shows the opposite.
Current usage metrics show cumulative count of Article Views (full-text article views including HTML views, PDF and ePub downloads, according to the available data) and Abstracts Views on Vision4Press platform.
Data correspond to usage on the plateform after 2015. The current usage metrics is available 48-96 hours after online publication and is updated daily on week days.
Initial download of the metrics may take a while.