Fig. 2.
Download original image
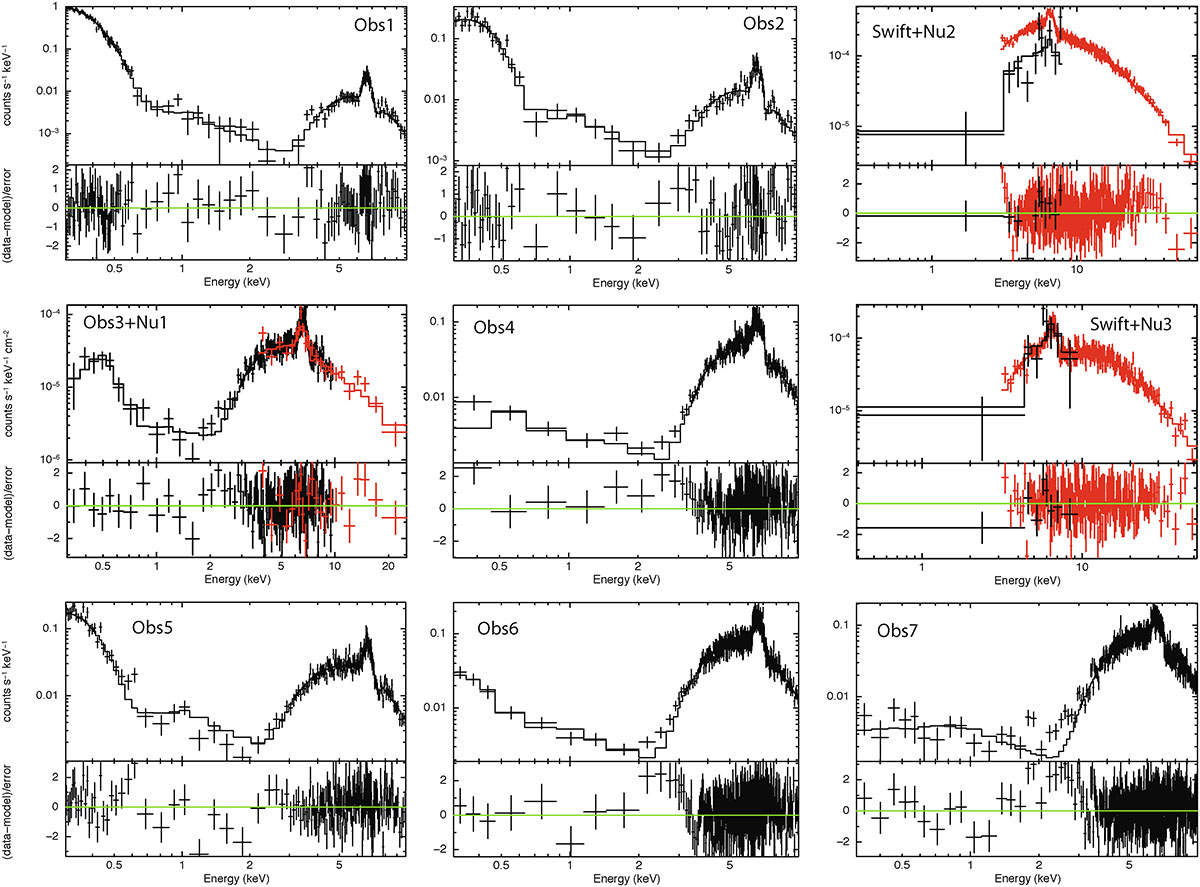
First and second columns: XMM-Newton/pn and NuSTAR (in red) spectra of T CrB taken during the SAS. The model parameters, listed in Table A.1, were obtained by simultaneously fitting the pn, MOS 1 and MOS 2 spectra during each pointing. Here we show only the pn spectra for clarity. Third column: NuSTAR/FPMA, XMM-Newton, and Swift spectra of T CrB taken during the faint state after the SAS. The Swift spectra were grouped at one count per bin and modeled using Cash statistic.
Current usage metrics show cumulative count of Article Views (full-text article views including HTML views, PDF and ePub downloads, according to the available data) and Abstracts Views on Vision4Press platform.
Data correspond to usage on the plateform after 2015. The current usage metrics is available 48-96 hours after online publication and is updated daily on week days.
Initial download of the metrics may take a while.