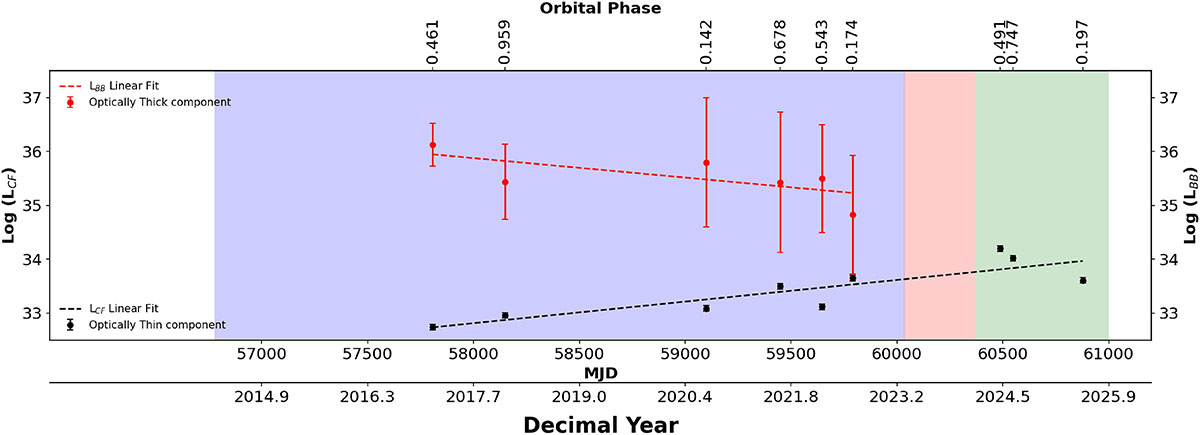
Fig. 3.
Download original image
Evolution of the luminosity from the black-body (red points) and hard X-ray emitting, cooling flow (black points) spectral components over time. The shaded areas mark the SAS, Dip and Recovery phase using the same color code as in Fig. 1. A WLS fit to the luminosity of the optically thick (BB) component (dotted red line) indicates that its slope is different from zero at the 2.58σ level. We include Nu2 and Nu3 observations taken in 2024 and Obs7 taken in 2025, whose spectra arise from the optically thin portion of the boundary layer, i.e., the cooling flow. Dotted black lines mark the WLS fit to the LCF evolution whose slope is different than zero at the 4.49σ level. The increase in its luminosity suggests that the accretion rate in the disk decreased over time, with the boundary layer becoming optically thinner and hotter.
Current usage metrics show cumulative count of Article Views (full-text article views including HTML views, PDF and ePub downloads, according to the available data) and Abstracts Views on Vision4Press platform.
Data correspond to usage on the plateform after 2015. The current usage metrics is available 48-96 hours after online publication and is updated daily on week days.
Initial download of the metrics may take a while.