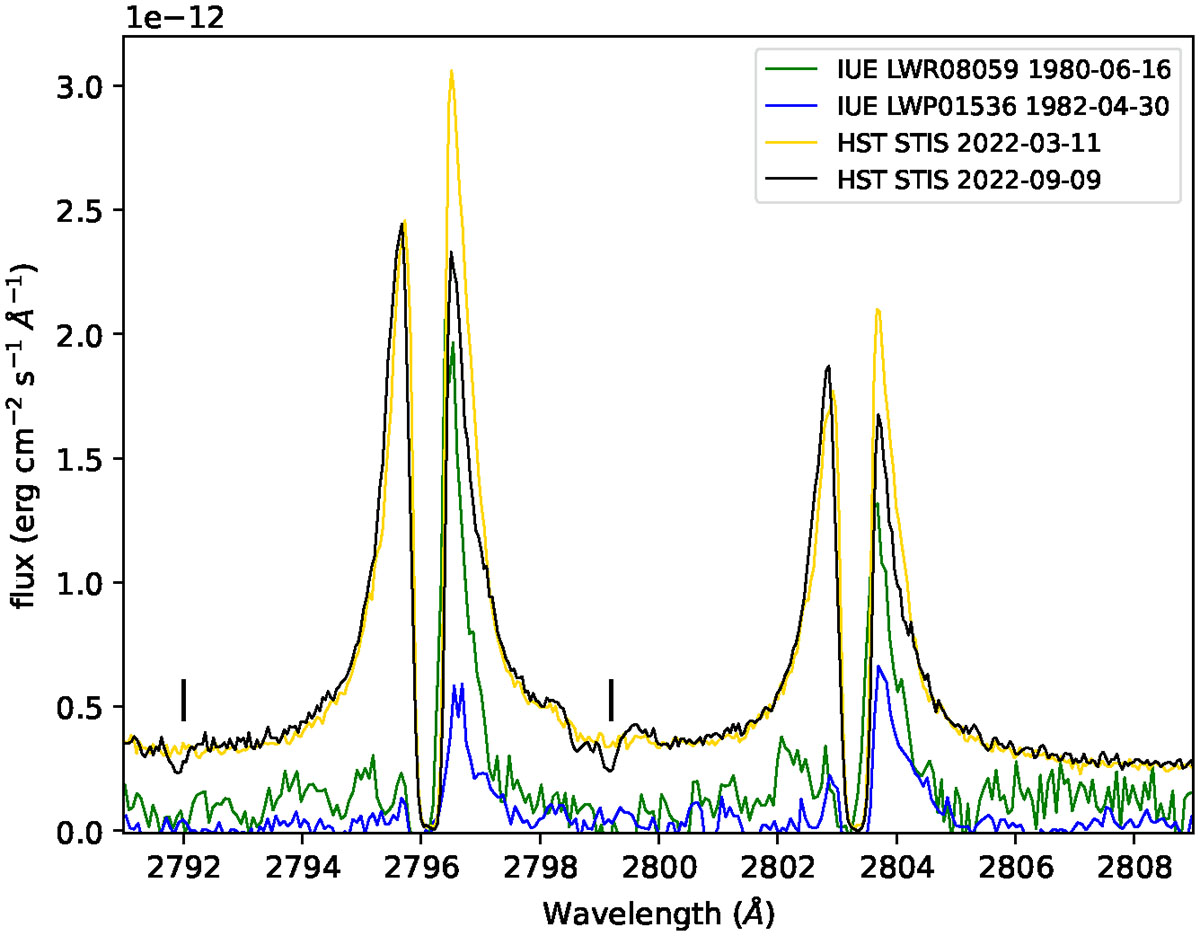
Fig. 4.
Download original image
Mg II doublet. IUE spectra from before the SAS are plotted together with the HST STIS spectra from the end of the SAS period. Two small black lines are added to guide the eye to the absorptions that match the two Mg II profiles: blueshifted outflow in the line of sight for the 2022-09-09 (MJD59469, phase 0.56) spectrum, but not in the 2022-09-09 (MJD 59831, phase 0.36) spectrum. Note: the IUE Mg II spectra seem to be missing the blue wing. The background during SAS is higher than in the IUE spectra. The flux scale is listed above the left corner of the image.
Current usage metrics show cumulative count of Article Views (full-text article views including HTML views, PDF and ePub downloads, according to the available data) and Abstracts Views on Vision4Press platform.
Data correspond to usage on the plateform after 2015. The current usage metrics is available 48-96 hours after online publication and is updated daily on week days.
Initial download of the metrics may take a while.