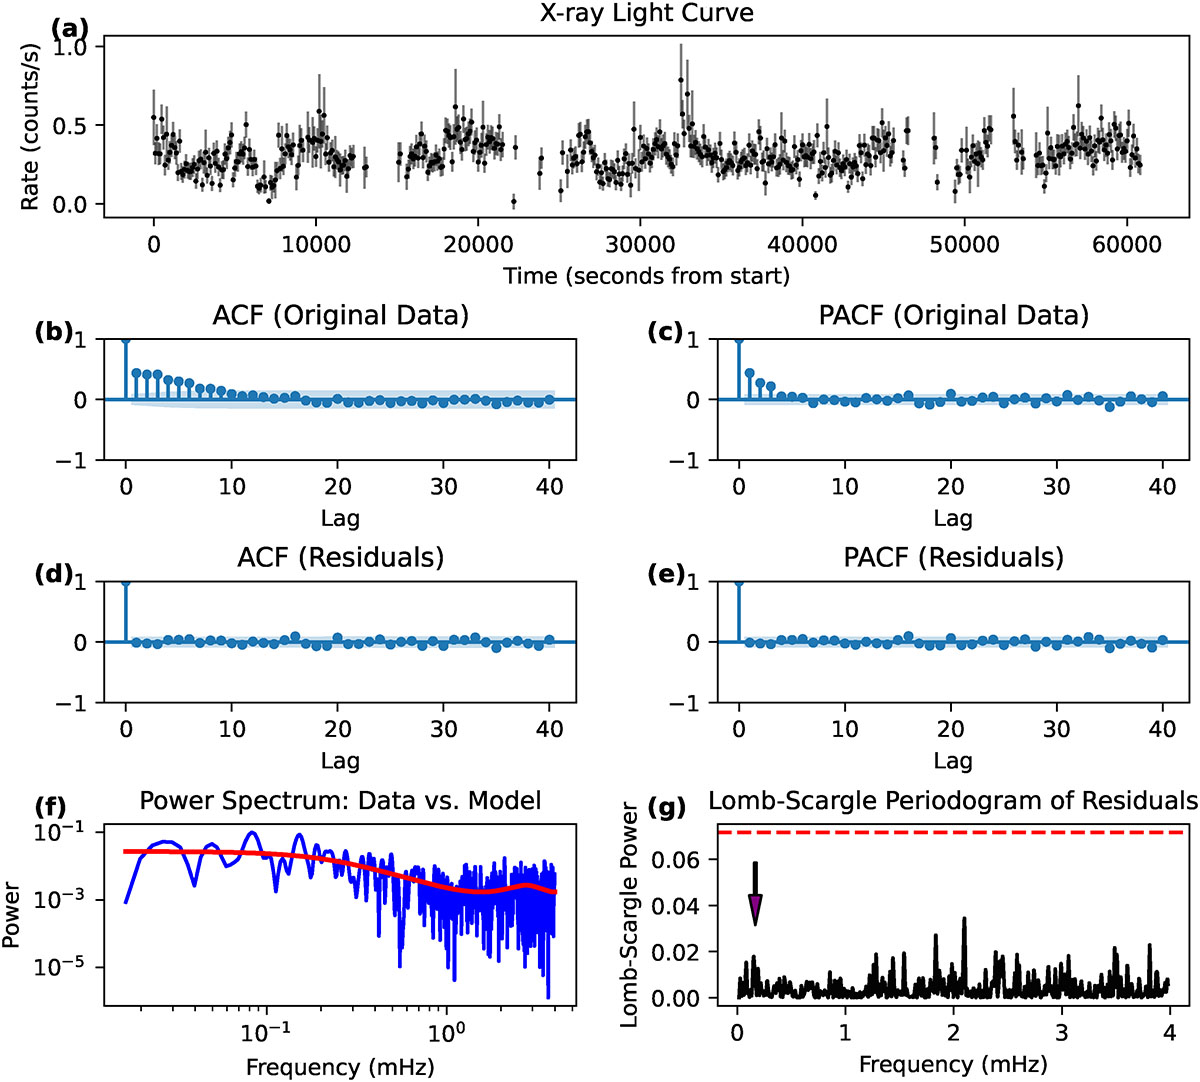
Fig. 5.
Download original image
Time-series analysis of the Obs1 XMM-Newton/pn+MOS1+MOS2 light curve of T CrB. (a) Full, original light curve, showing significant aperiodic variability (red noise) across the observation. (b) ACF of the original mean-subtracted data. The slow decay confirms the presence of strong, correlated red noise. (c) PACF of the original data. The significant power concentrated in the first few lags suggests that an autoregressive (AR) process is a suitable model for the red noise. (d) ACF of the residuals after subtracting the best-fit AR(p) model. The lack of significant correlation spikes indicates that the model has successfully “whitened” the data, removing the dominant red noise component. (e) PACF of the residuals. Similarly to the residual ACF, the absence of significant spikes confirms the goodness-of-fit of the AR(p) model. (f) log-log plot of the LS power spectrum of the original data (blue), which shows a classic red-noise profile with power increasing toward lower frequencies. The theoretical power spectrum of the fitted AR(p) model (red) are overplotted, demonstrating an excellent match to the stochastic properties of the light curve. (g) LS power spectrum of the “whitened” residuals. This plot should reveal periodic signals that were previously buried under the red noise. The horizontal dashed line marks the 99.99% FAP level. The most prominent peak does not rise significantly above this threshold, indicating that its periodicity is not statistically significant. The arrow marks the frequency corresponding to the 6000 s period reported by Zhekov & Tomov (2019).
Current usage metrics show cumulative count of Article Views (full-text article views including HTML views, PDF and ePub downloads, according to the available data) and Abstracts Views on Vision4Press platform.
Data correspond to usage on the plateform after 2015. The current usage metrics is available 48-96 hours after online publication and is updated daily on week days.
Initial download of the metrics may take a while.