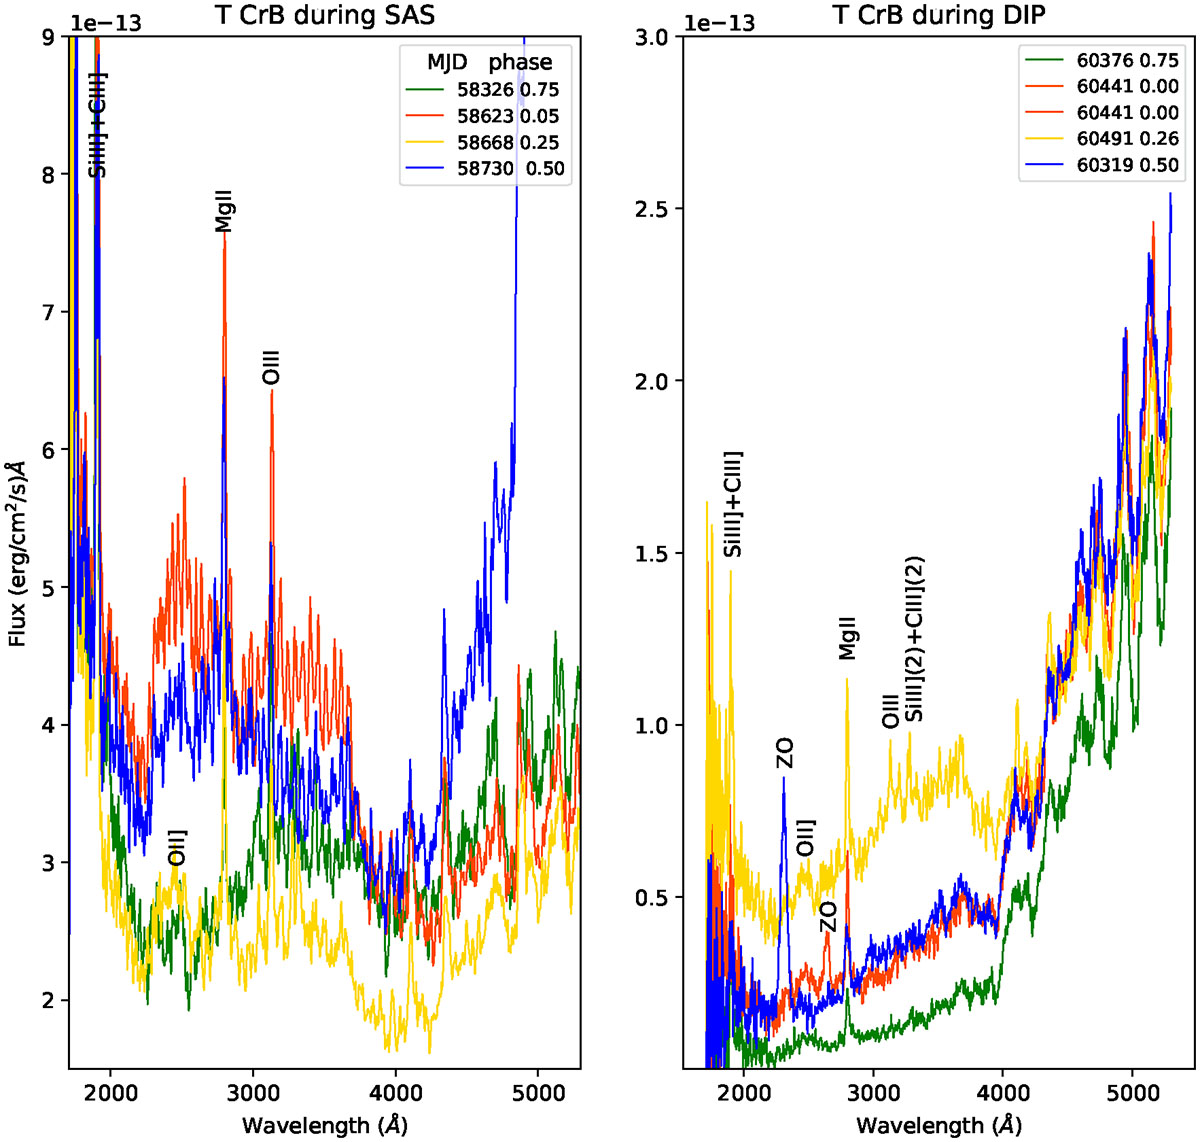
Fig. 6.
Download original image
Swift UV spectra taken close to orbital phases 0.75, 0.0, 0.25, and 0.5 (velocity phase; WD occultation at 0.75). The left panel shows that during the SAS, the Balmer jump went into emission, likely due to scattering in the accretion disk. However, the dust absorption dip around 2150 Å is not more pronounced after SAS ends. During the dip after the SAS, the overall flux was much lower and there was no significant additional emission in the 2300–3600 Å range. The blue dip (phase 0.5) spectrum shows contamination from a zeroth order around 2310 Å and in the orange (phase 0) spectrum around 2650 Å, which should be ignored. In the SAS spectra, we see second-order lines of (N III](2) at 2900 Å, the Si III](2), and C III](2) lines at 3290 and 3320 Å). Fe II UV triplet absorptions are present at 2260, 2600 Å. Finally, H I 4105 and 4360 Å, as well as Mg II 2800, C III] 1909, and Si III] 1892 Å are in emission. The flux scale is at the top-left of each figure.
Current usage metrics show cumulative count of Article Views (full-text article views including HTML views, PDF and ePub downloads, according to the available data) and Abstracts Views on Vision4Press platform.
Data correspond to usage on the plateform after 2015. The current usage metrics is available 48-96 hours after online publication and is updated daily on week days.
Initial download of the metrics may take a while.