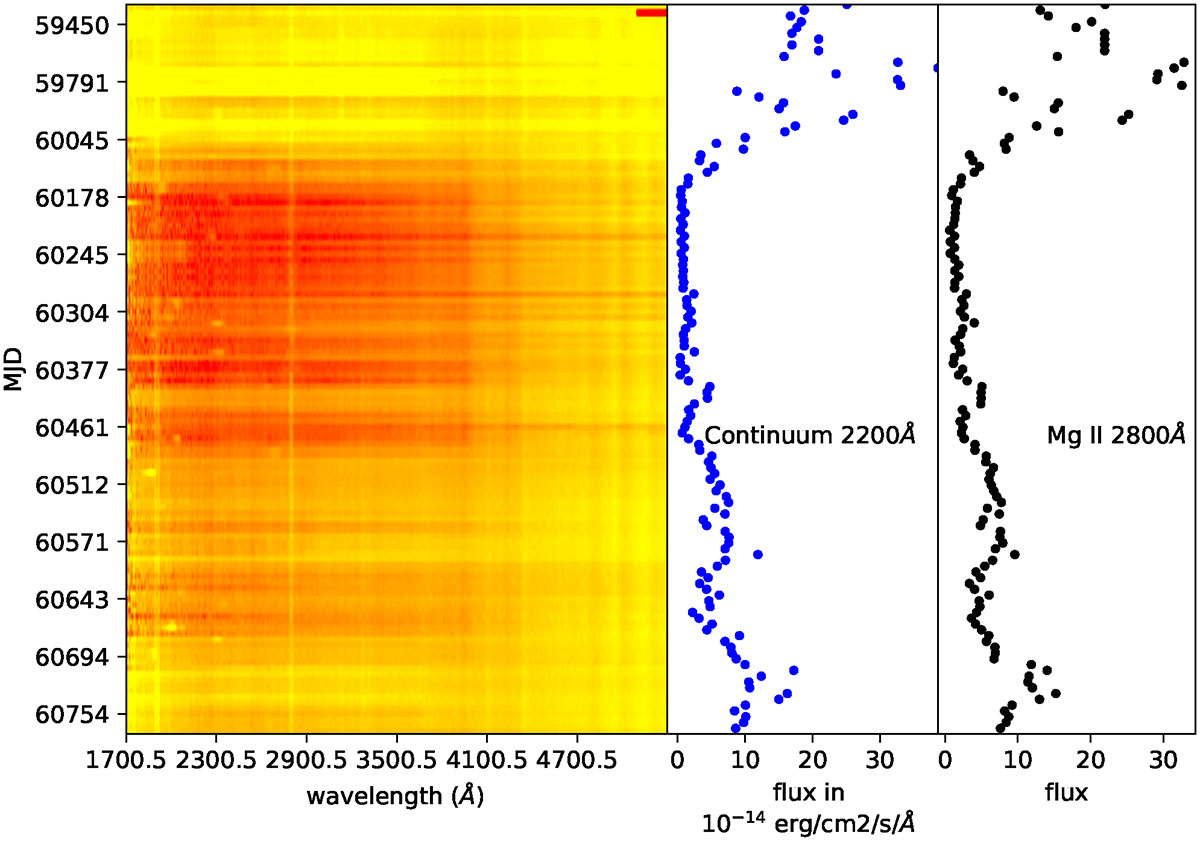
Fig. 7.
Download original image
Evolution of UV emission during and after the dip. The left-hand panel is an image composed of 127 Swift grism UVOT spectra taken from the end of the SAS period through the dip and the recent uptick in brightness. The intensity varies from yellow to red with yellow the brightest, red the weakest. With the exception of the pre-dip times and Swift observing restrictions, the spectra were typically taken around every 10 days. Some bright spots in the spectra are due to contaminating zeroth orders from field sources. Besides the dip, bright emission lines, the blend of Si III]/C III] (1892 and 1909 Å), and Mg II (2800 Å) are seen as vertical yellow lines, on the red side the spectrum dominated by the red giant with its HI and molecular lines. This panel should also be compared with Fig. 6 for context. In addition, the panel in the middle shows the continuum variation at 2200 Å and highlights its behavior during the dip. In all three panels, the time axis is the Y-axis. The rightmost panel shows the net flux in Mg II 2800 Å which is formed partially in the low chromosphere and/or wind of the RG and partially in the accretion disk. The flux in the emission lines, e.g., Mg II, closely follows the UV continuum variations; this was discovered with IUE by Meier et al. (1994).
Current usage metrics show cumulative count of Article Views (full-text article views including HTML views, PDF and ePub downloads, according to the available data) and Abstracts Views on Vision4Press platform.
Data correspond to usage on the plateform after 2015. The current usage metrics is available 48-96 hours after online publication and is updated daily on week days.
Initial download of the metrics may take a while.