Open Access
Fig. 2
Download original image
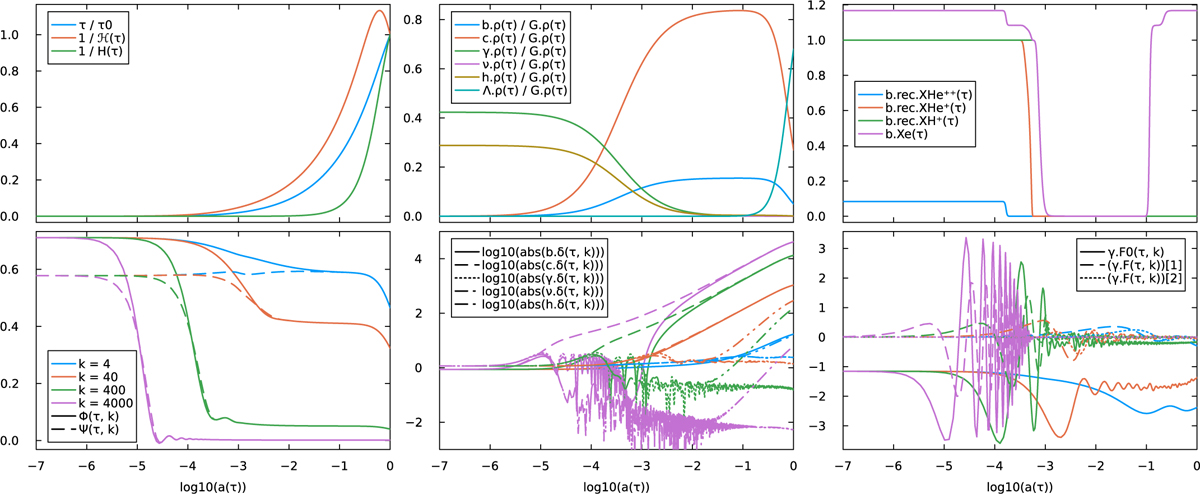
SymBoltz includes plotting recipes that make it easy to visualize any symbolic variable or expression thereof from a solution of the Einstein-Boltzmann equations. This plot was made with one short line of code per subplot. Wavenumbers k are in units of H0/c.
Current usage metrics show cumulative count of Article Views (full-text article views including HTML views, PDF and ePub downloads, according to the available data) and Abstracts Views on Vision4Press platform.
Data correspond to usage on the plateform after 2015. The current usage metrics is available 48-96 hours after online publication and is updated daily on week days.
Initial download of the metrics may take a while.