Fig. 1
Download original image
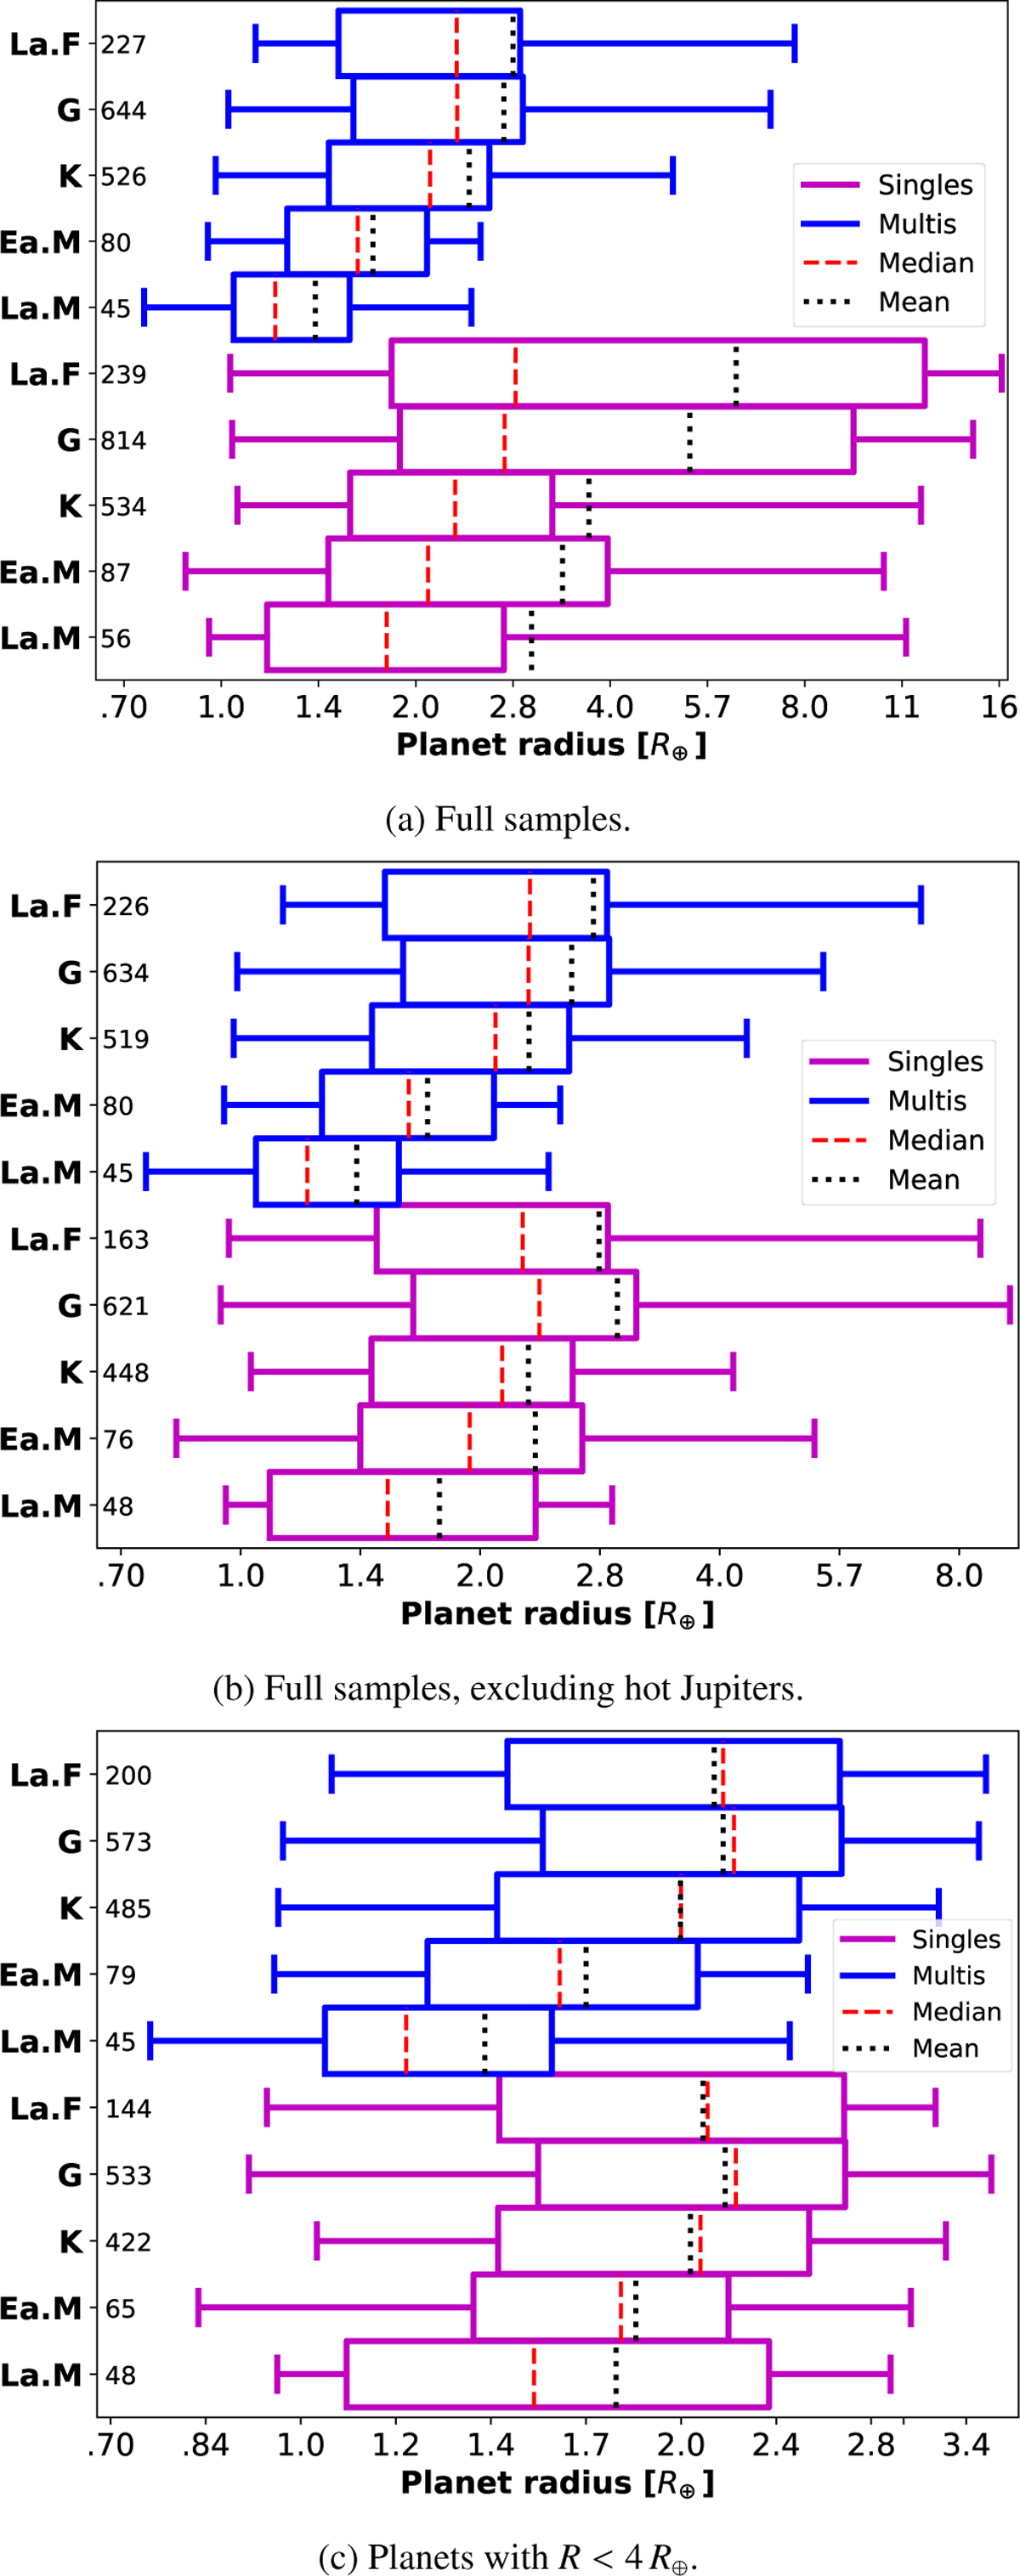
Boxplots showing the radius distributions of all the singles (magenta) and multis (blue) examined in this work, divided into five samples based on the spectral type of the host star. Each box includes the data between the 0.25th and 0.75th quantiles, while the whiskers extend to the 5th and 95th percentiles. The median and mean radii of both the multis and singles increase as the host star temperature increases. The number of planets in each sample is indicated next to the host star type.
Current usage metrics show cumulative count of Article Views (full-text article views including HTML views, PDF and ePub downloads, according to the available data) and Abstracts Views on Vision4Press platform.
Data correspond to usage on the plateform after 2015. The current usage metrics is available 48-96 hours after online publication and is updated daily on week days.
Initial download of the metrics may take a while.