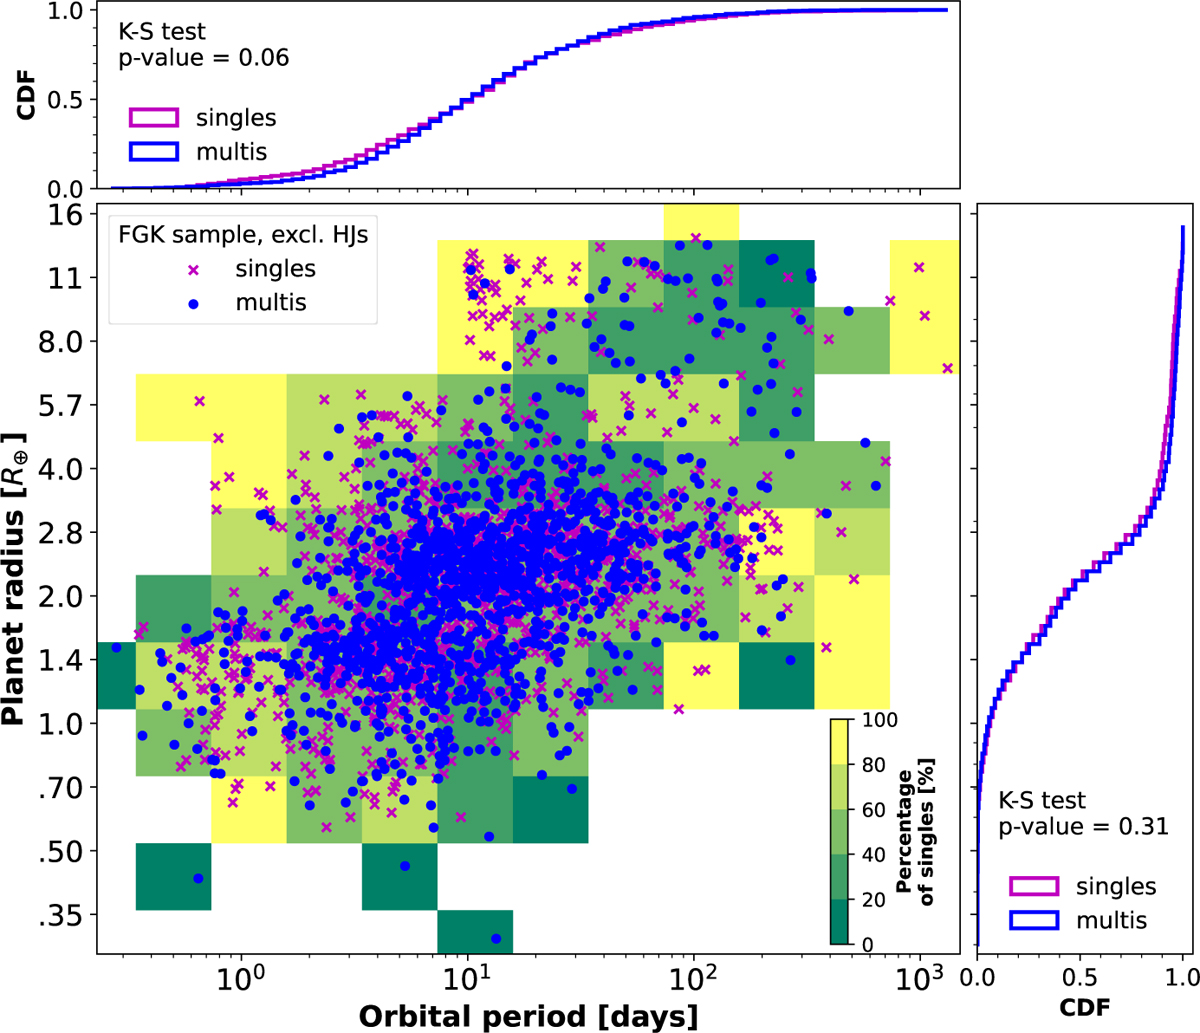
Fig. 7
Download original image
Radii as a function of orbital periods of the singles (magenta crosses) and multis (blue bullets) in the FGK sample, excluding hot Jupiters. The colour of each grid cell represents the percentage of planets that are singles within the cell, as indicated by the colour bar (see Table 3). The upper and the right panels display the empirical cumulative distribution functions of the orbital periods and planetary radii, respectively. The K–S test p-values indicate that the radii and orbital period distributions of the singles and multis are statistically indistinguishable.
Current usage metrics show cumulative count of Article Views (full-text article views including HTML views, PDF and ePub downloads, according to the available data) and Abstracts Views on Vision4Press platform.
Data correspond to usage on the plateform after 2015. The current usage metrics is available 48-96 hours after online publication and is updated daily on week days.
Initial download of the metrics may take a while.