Fig. 11
Download original image
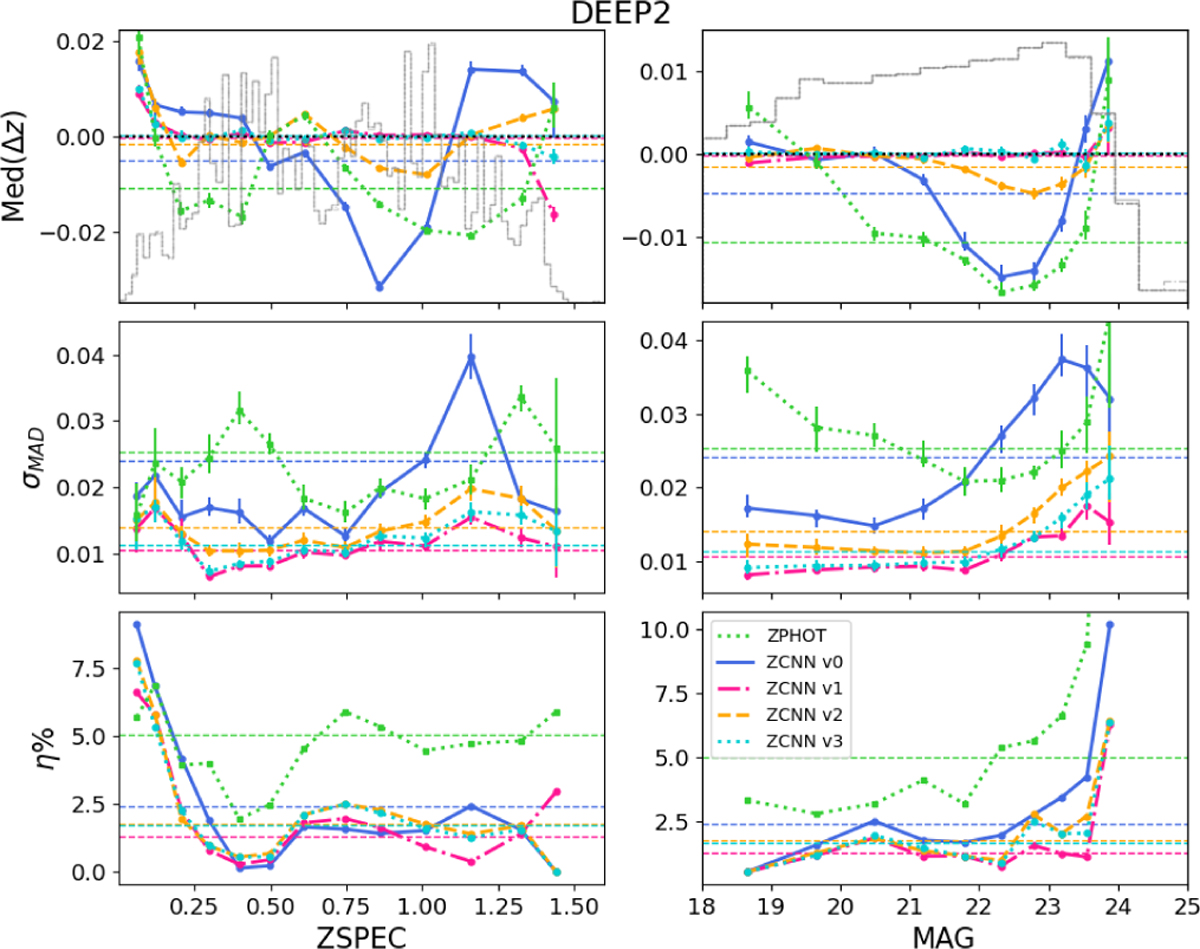
Performance of the adversarial model trained with the COSMOS UDF sample alone (v2, orange lines) or with the COSMOS UDF sample supplemented by the DEEP2 spectroscopic sample in cross-validation mode (v3, turquoise lines) for the DEEP2 spectroscopic sample as a function of redshift and magnitude. The dark blue and pink lines are the baseline results (v0 and v1) shown in Fig. 8. The ugrizy SED-fitting metrics are shown in green.
Current usage metrics show cumulative count of Article Views (full-text article views including HTML views, PDF and ePub downloads, according to the available data) and Abstracts Views on Vision4Press platform.
Data correspond to usage on the plateform after 2015. The current usage metrics is available 48-96 hours after online publication and is updated daily on week days.
Initial download of the metrics may take a while.