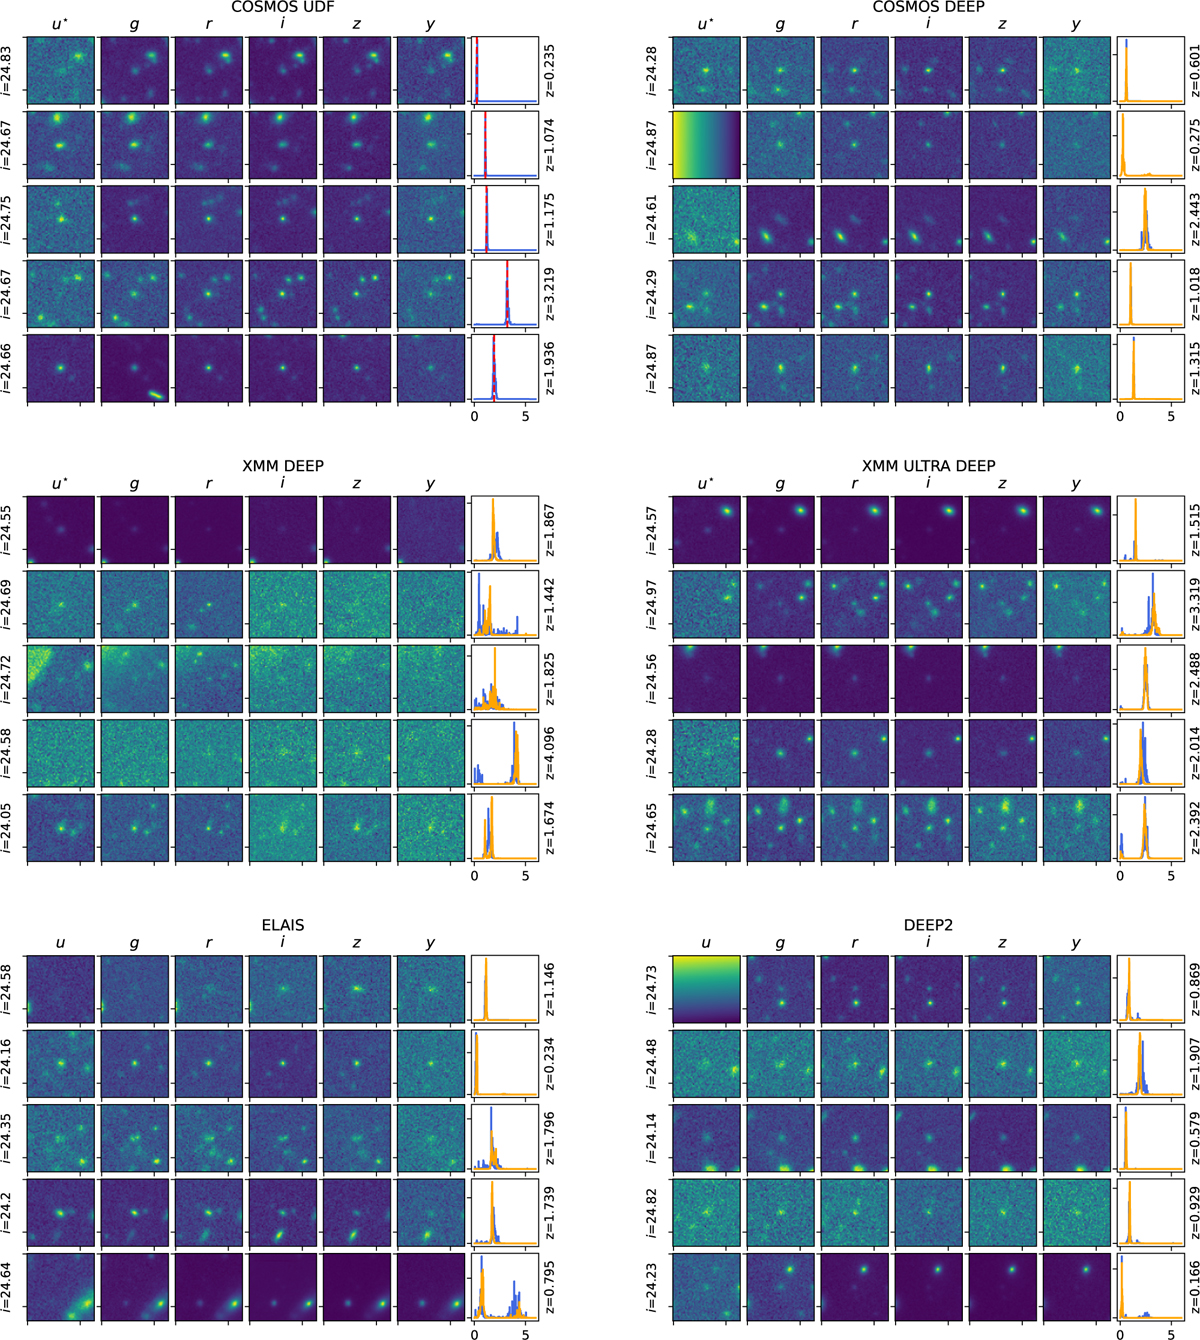
Fig. A.1
Download original image
A random sample of u* grizy or ugrizy images of galaxies at 24<i<25 in the 6 HSC subregions. For the COSMOS UDF, the right most panels show the PDFs from the baseline cross-validation training and the z values on the right, marked by vertical red dashed lines, are the redshift labels (spectroscopic or C2020). For the regions other than COSMOS UDF, the right most panels show the PDFs (PDFw <1.5) from the v0 model in blue, and for the v2 model in orange. The z values on the right are the v2 redshift estimates.
Current usage metrics show cumulative count of Article Views (full-text article views including HTML views, PDF and ePub downloads, according to the available data) and Abstracts Views on Vision4Press platform.
Data correspond to usage on the plateform after 2015. The current usage metrics is available 48-96 hours after online publication and is updated daily on week days.
Initial download of the metrics may take a while.