Fig. 5
Download original image
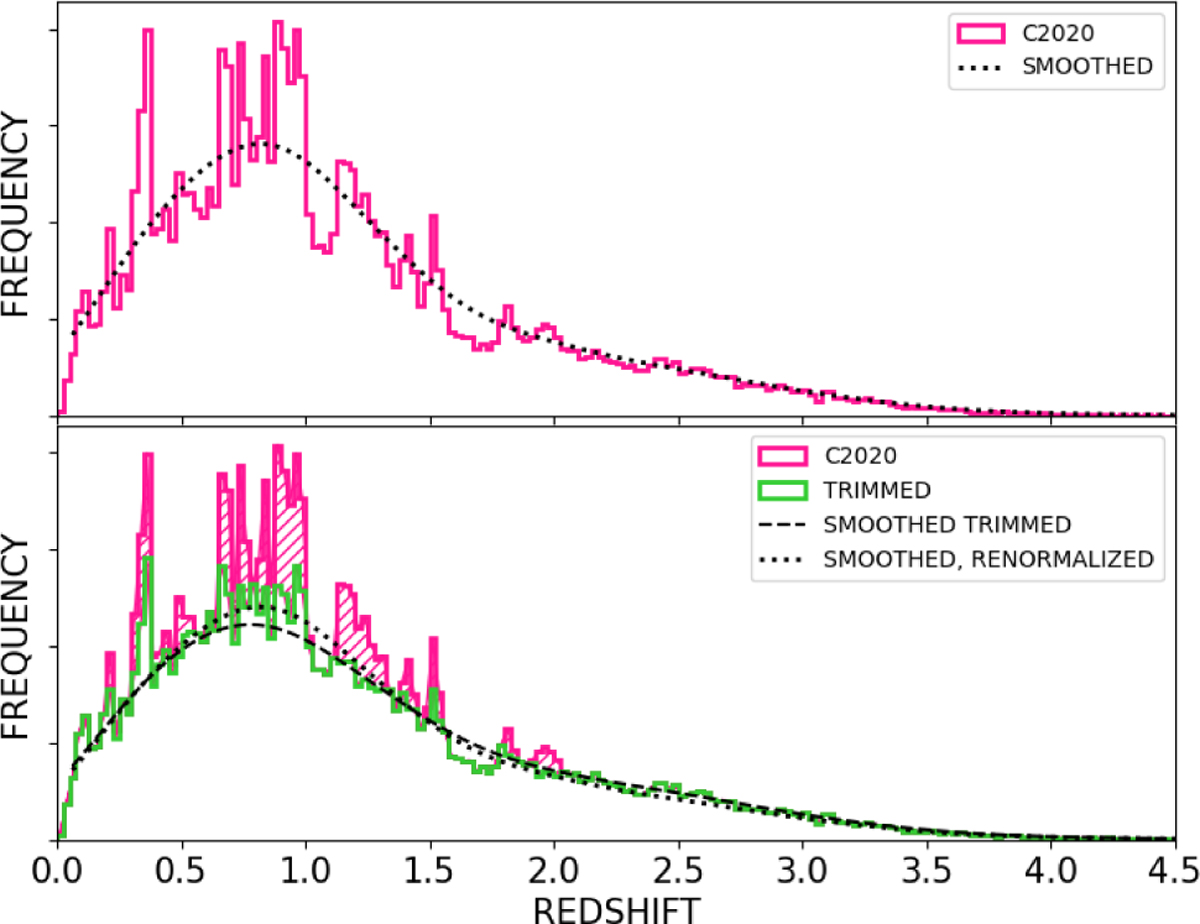
Top panel: simple smoothing of the training redshift distribution using SciPy’s KDE function. Bottom panel: galaxies from the highest-density regions in each of the large spikes protruding above the smoothed distribution were removed from the initial sample, resulting in the green histogram, which was then smoothed using KDE (dashed line). The hashed pink spikes show the number and redshift location of the discarded galaxies (∼ 14% in total at i<25).
Current usage metrics show cumulative count of Article Views (full-text article views including HTML views, PDF and ePub downloads, according to the available data) and Abstracts Views on Vision4Press platform.
Data correspond to usage on the plateform after 2015. The current usage metrics is available 48-96 hours after online publication and is updated daily on week days.
Initial download of the metrics may take a while.