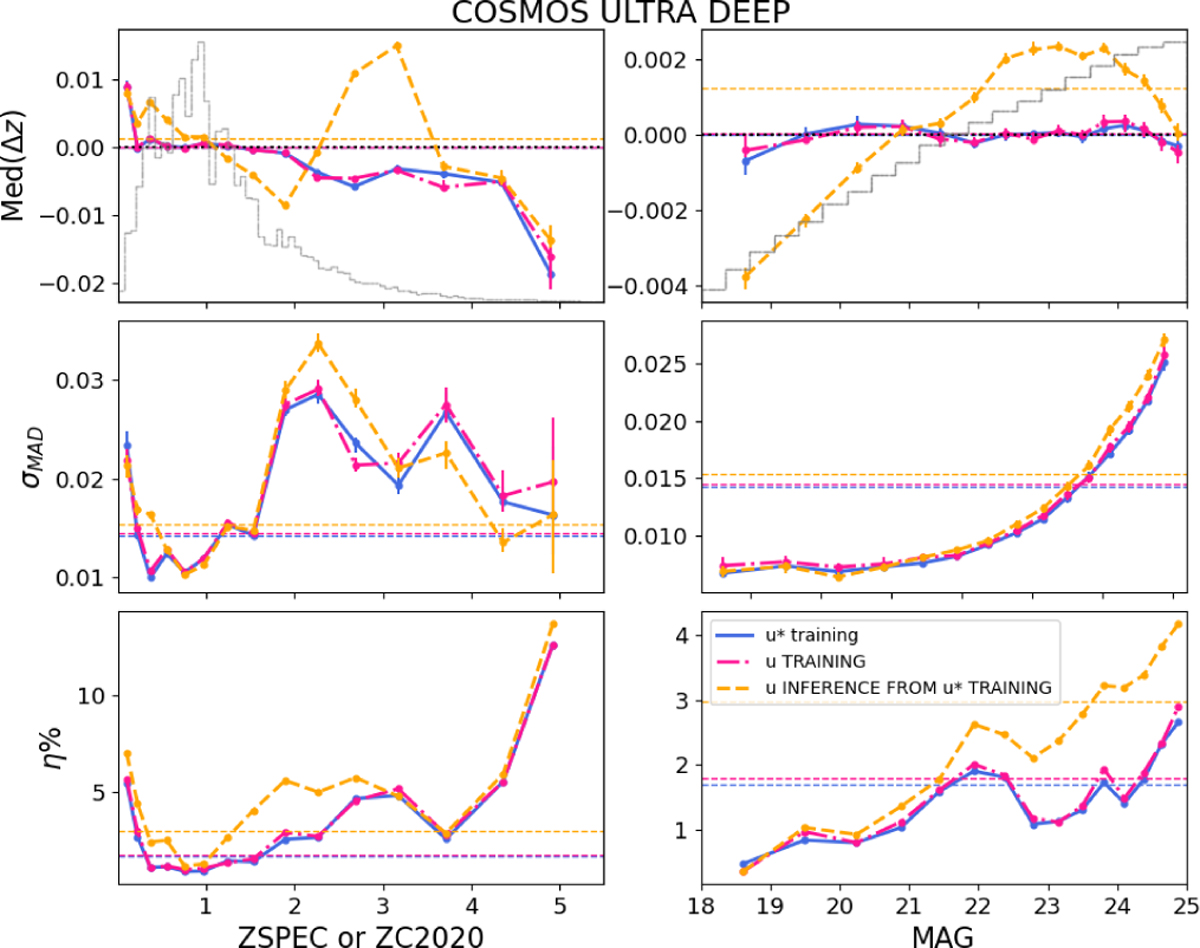
Fig. 7
Download original image
CNN metrics as a function of redshift label and i-band magnitude for the u* grizy and ugrizy validation sets, and for the u dataset inferred from the u*-trained model. Using either set of bands for training makes no difference but inferring one from the other significantly degrades the performance. In this and all similar figures, the redshift and magnitude distributions are overlaid in gray in the corresponding upper panels, and the 1 σ error bars are based on 100 bootstrap samples.
Current usage metrics show cumulative count of Article Views (full-text article views including HTML views, PDF and ePub downloads, according to the available data) and Abstracts Views on Vision4Press platform.
Data correspond to usage on the plateform after 2015. The current usage metrics is available 48-96 hours after online publication and is updated daily on week days.
Initial download of the metrics may take a while.