Fig. 1.
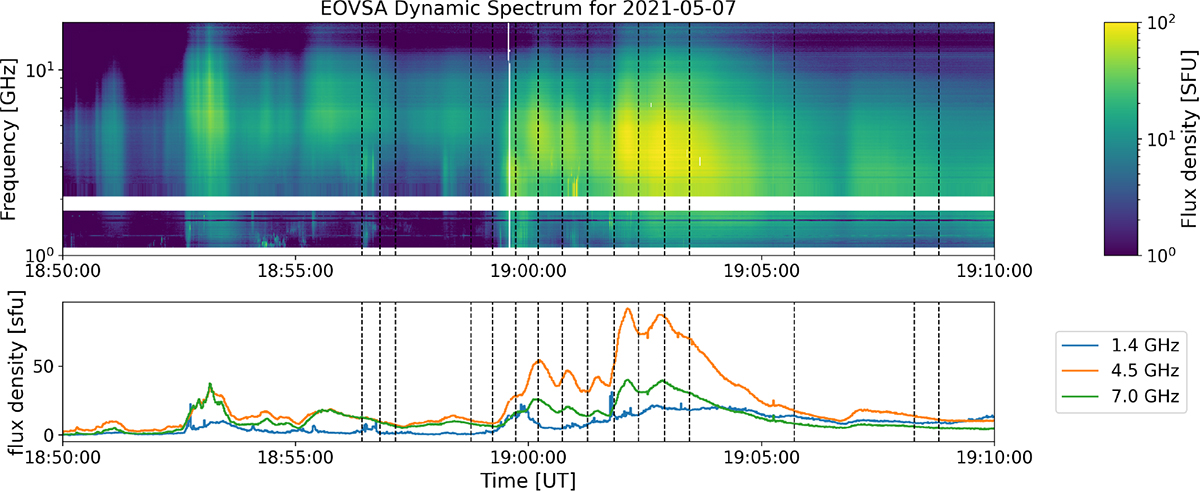
Download original image
Top: Background-subtracted dynamic total power radio spectrum of the 2021-05-07 solar flare observed by EOVSA (top), color scale shows the flux density in solar flux unit (sfu). Bottom: Time profiles at selected frequencies illustrate the burst evolution. The black dashed lines mark the overplotted times of XRT observations.
Current usage metrics show cumulative count of Article Views (full-text article views including HTML views, PDF and ePub downloads, according to the available data) and Abstracts Views on Vision4Press platform.
Data correspond to usage on the plateform after 2015. The current usage metrics is available 48-96 hours after online publication and is updated daily on week days.
Initial download of the metrics may take a while.