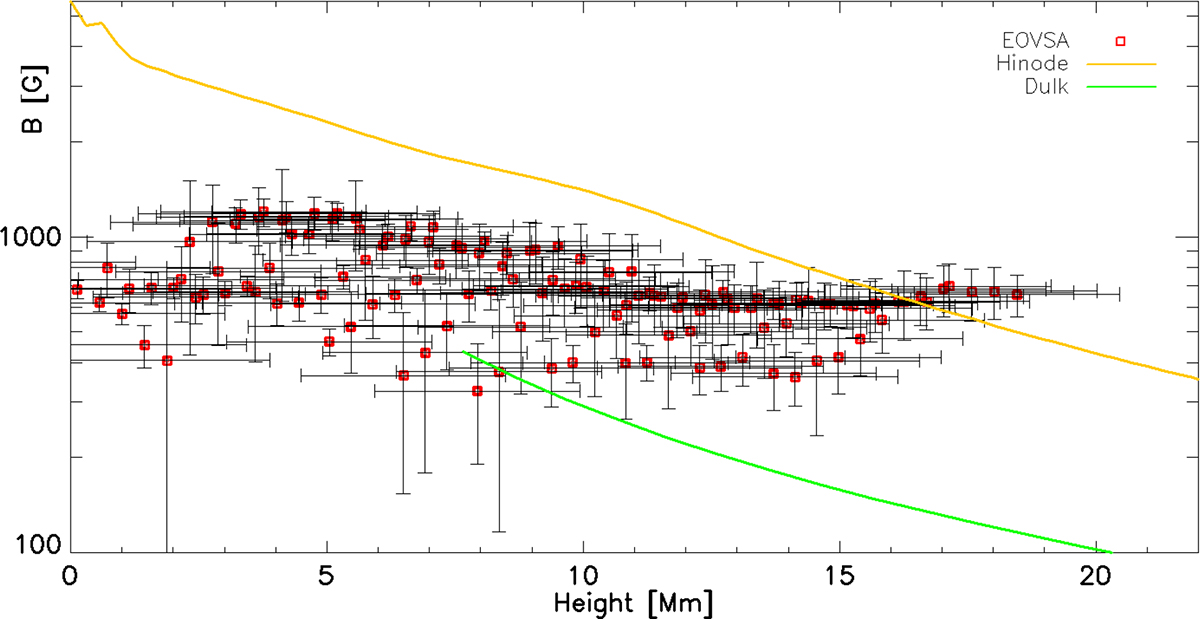
Fig. 10.
Download original image
Scatter plot of the representative heights of the EOVSA microwave source (estimated by intersecting the EOVSA lines of sight with the plane defined by the Sun’s rotation axis and the geometric center of the SXR source; see Fig. 3) versus the corresponding mean magnetic field strengths. Vertical and horizontal bars indicate uncertainties in height and magnetic field strength, respectively. The green and orange lines show empirical magnetic field height profiles from Fedenev et al. (2023) overplotted for reference. The correspondence indicates that our reconstructed magnetic field values are physically plausible and lie within the expected range for active region loops.
Current usage metrics show cumulative count of Article Views (full-text article views including HTML views, PDF and ePub downloads, according to the available data) and Abstracts Views on Vision4Press platform.
Data correspond to usage on the plateform after 2015. The current usage metrics is available 48-96 hours after online publication and is updated daily on week days.
Initial download of the metrics may take a while.