Fig. 11.
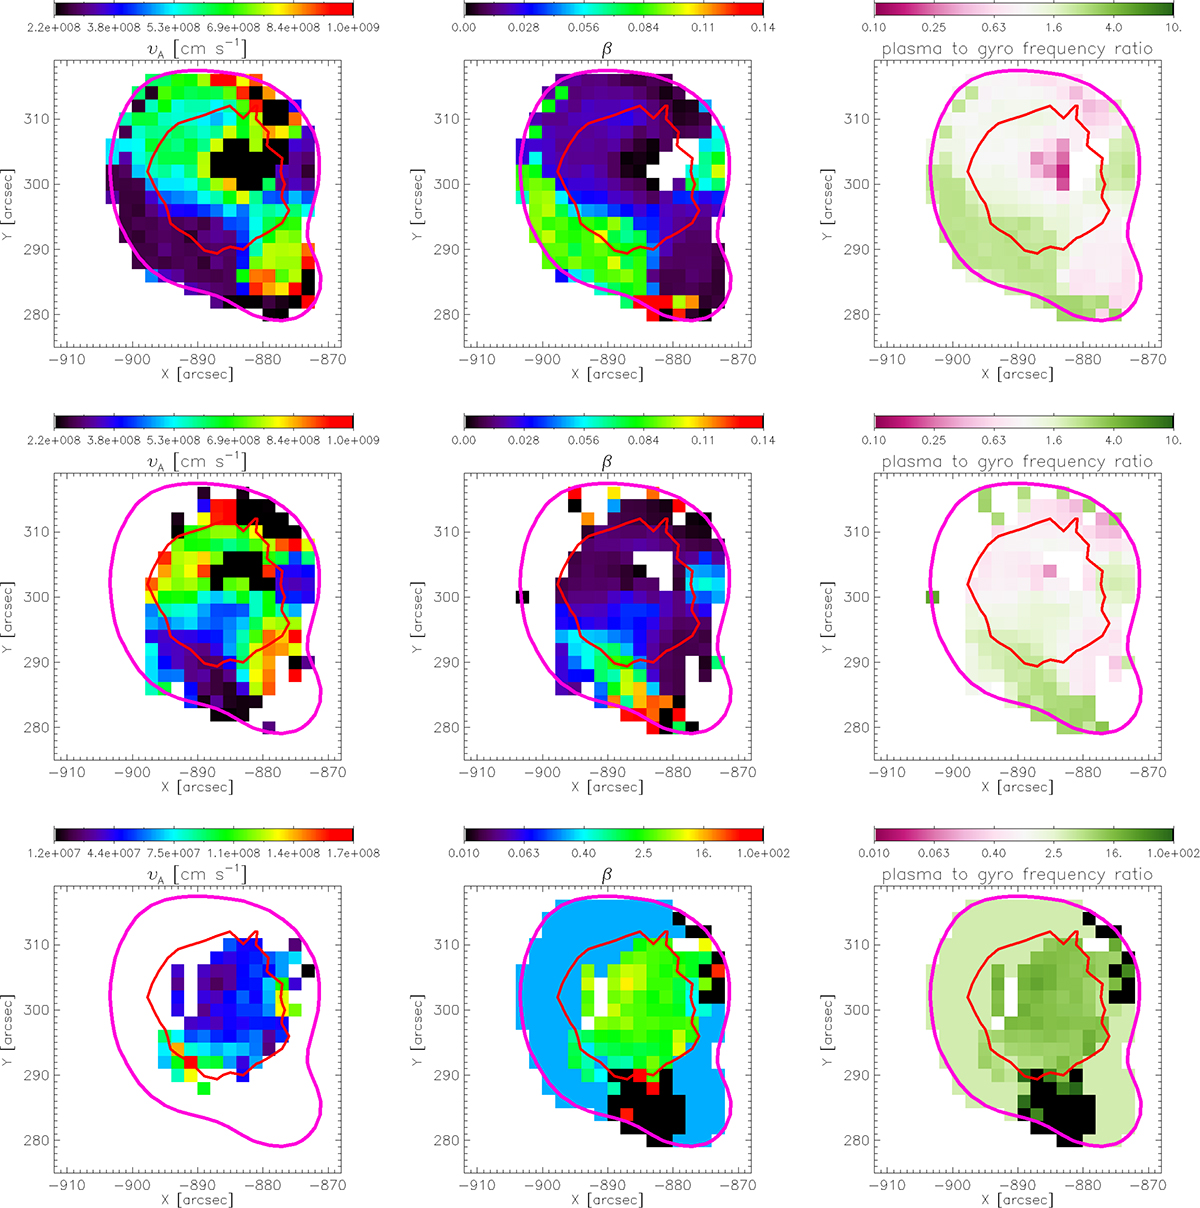
Download original image
Maps of the Alfvén velocity (left), plasma beta (center), and plasma-to-gyro frequency ratio (right) for the high-B source (top two rows, time intervals 18:55:00–18:57:00 and 18:57:00–18:58:00 UT) and the low-B source (bottom row, 18:55:00–18:57:00 UT). The red contour shows the 20% ROI level from Hinode/XRT at 18:56:25 UT, and the violet contour indicates the 10% brightness level from the 5.79 GHz EOVSA image at 18:55:44 UT.
Current usage metrics show cumulative count of Article Views (full-text article views including HTML views, PDF and ePub downloads, according to the available data) and Abstracts Views on Vision4Press platform.
Data correspond to usage on the plateform after 2015. The current usage metrics is available 48-96 hours after online publication and is updated daily on week days.
Initial download of the metrics may take a while.