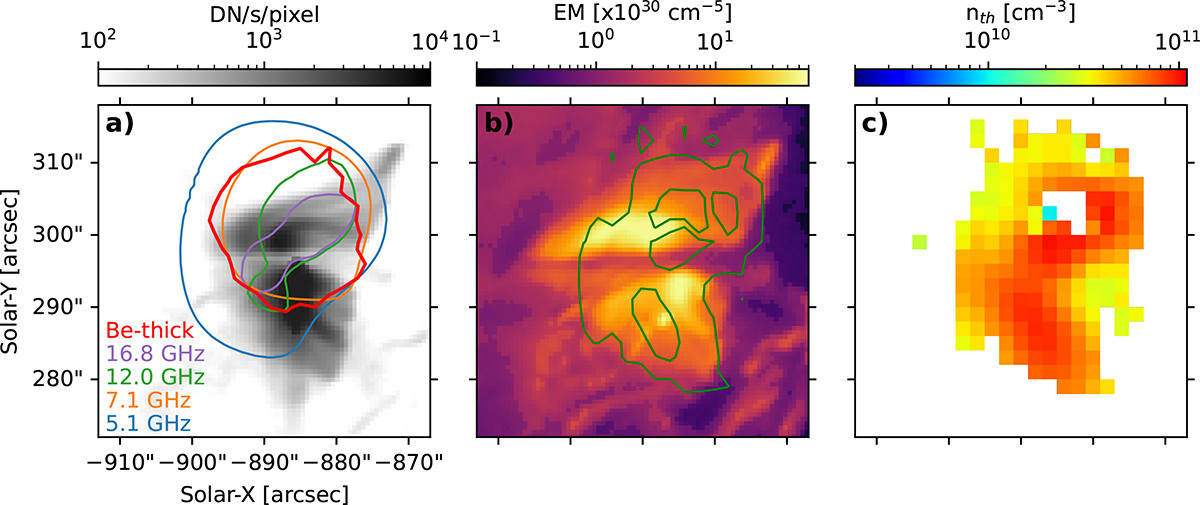
Fig. 2.
Download original image
Panel a: AIA 94 Å image at 18:56:59 UT showing the flaring region. The EUV flux tube system is partly occulted by the preexisting cool filament (a horizontal absorption feature). Thin colored contours represent 20% of EOVSA microwave brightness at four frequencies indicated in the legend. The thick red contour shows 20% level of the soft X-ray source observed by Hinode/XRT (Be-thick filter) at 18:56:25 UT. Panel b: Total emission measure of the flare region, with the thin green contour marks the region of enhanced thermal density at the levels of 3.6 × 1010 cm−3 and 8 × 1010 cm−3, as shown in the bottom panel of Fig. 7. Given the peak EM value of ∼2 × 1031 cm−5 and a loop depth of ∼20″ (∼14 Mm, roughly matching the spatial scale in the plane of the sky), the inferred peak electron density is approximately 1.2 × 1011 cm−3, consistent with the nth values inferred from the microwave spectral fitting and shown in panel (c); this is also the same as the one shown in the bottom panel of Fig. 7. Note: most of the individual EOVSA images (contours in panel a) do not have loop shapes matching EUV loops; however, the thermal number density inferred from the multifrequency spectral fitting reveals a loop-like structure (shown in panel c), matching the AIA-derived EM map in panel b.
Current usage metrics show cumulative count of Article Views (full-text article views including HTML views, PDF and ePub downloads, according to the available data) and Abstracts Views on Vision4Press platform.
Data correspond to usage on the plateform after 2015. The current usage metrics is available 48-96 hours after online publication and is updated daily on week days.
Initial download of the metrics may take a while.