Fig. 3.
Download original image
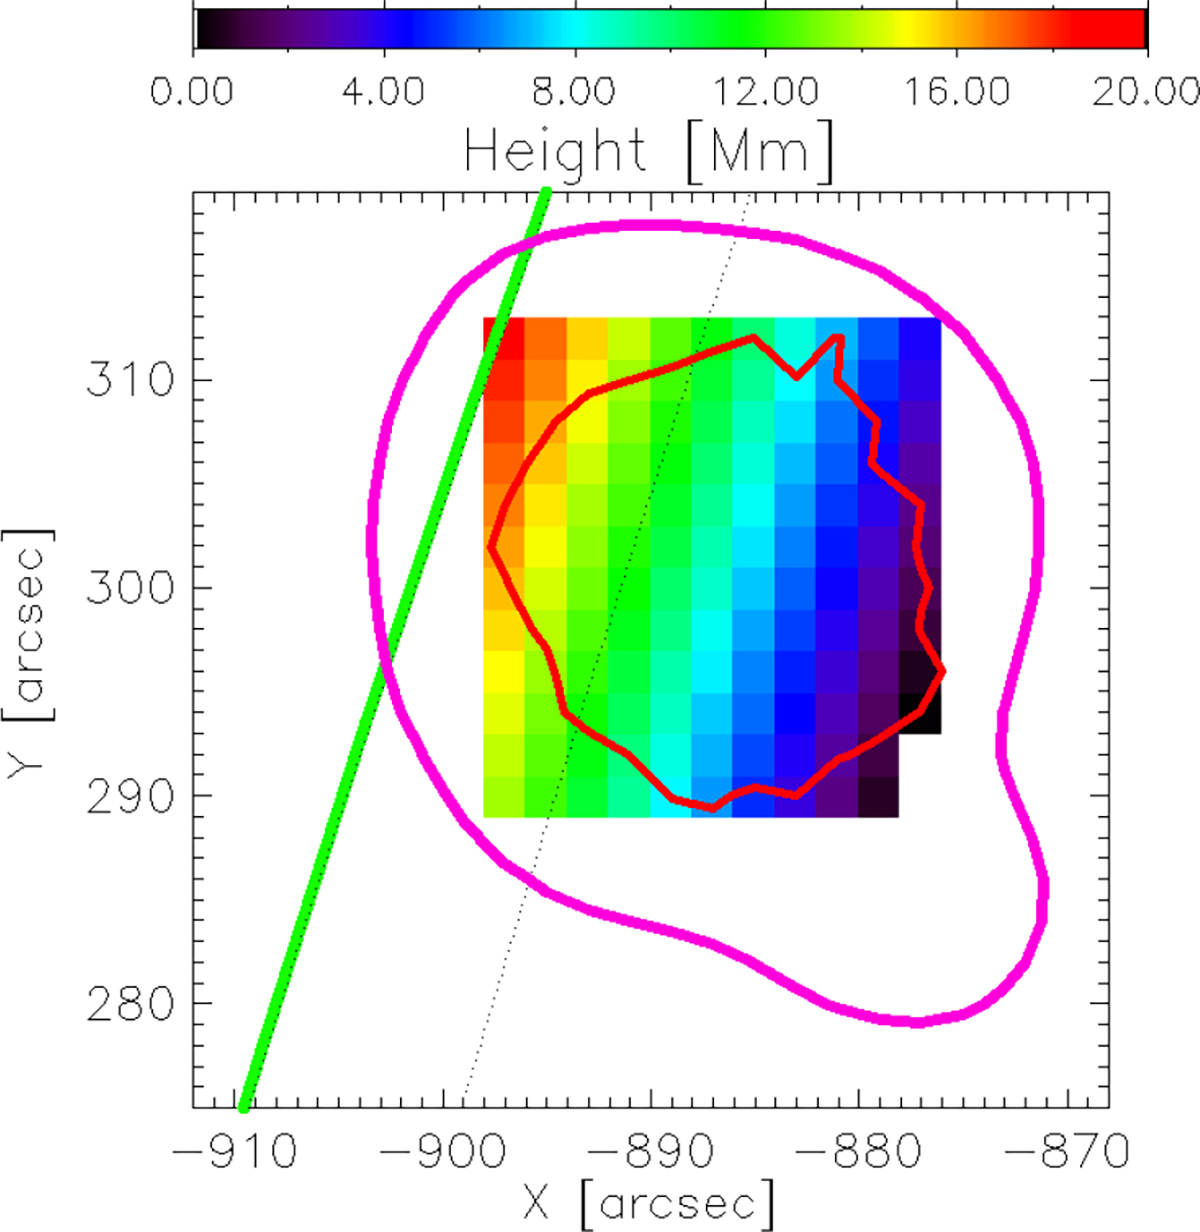
Heights of the SXR source in the plane made by the solar rotation axis and the geometrical center of the SXR source obtained by Ryan et al. (2024) from the 3D stereoscopic reconstruction of the joint STIX/XRT data. The green line represents the solar limb. The red contour shows Hinode/XRT 20% brightness at 18:56:25 UT (as in Fig. 2a). The violet contour shows 10% of the 5.79 GHz EOVSA image taken at 18:55:44 UT.
Current usage metrics show cumulative count of Article Views (full-text article views including HTML views, PDF and ePub downloads, according to the available data) and Abstracts Views on Vision4Press platform.
Data correspond to usage on the plateform after 2015. The current usage metrics is available 48-96 hours after online publication and is updated daily on week days.
Initial download of the metrics may take a while.