Fig. 4.
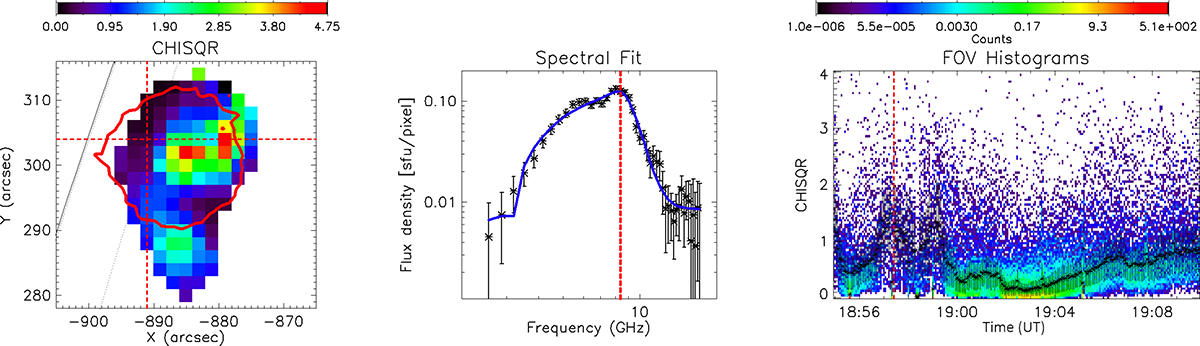
Download original image
Goodness of the spectral fit. Left: χ2 (=reduced Chi2) map for the time frame of 18:57:24 UT. Red contour shows the XRT brightness contour computed for 18:57:08 UT. Middle: Example of the spatially resolved spectrum from the pixel shown by the red cursor (i.e., the intersection of the two red dashed lines) in the left panel and corresponding good spectral model fit shown by the blue curve. The vertical dashed red line marks the spectral peak that demarcates the optically thick (to the left) and thin (to the right) parts of the spectrum. Right: Evolving 2D histogram of the χ2 metric (colored dots) and the corresponding median values (black symbols with error bars). This demonstrates that the spectral fits are mainly acceptable.
Current usage metrics show cumulative count of Article Views (full-text article views including HTML views, PDF and ePub downloads, according to the available data) and Abstracts Views on Vision4Press platform.
Data correspond to usage on the plateform after 2015. The current usage metrics is available 48-96 hours after online publication and is updated daily on week days.
Initial download of the metrics may take a while.