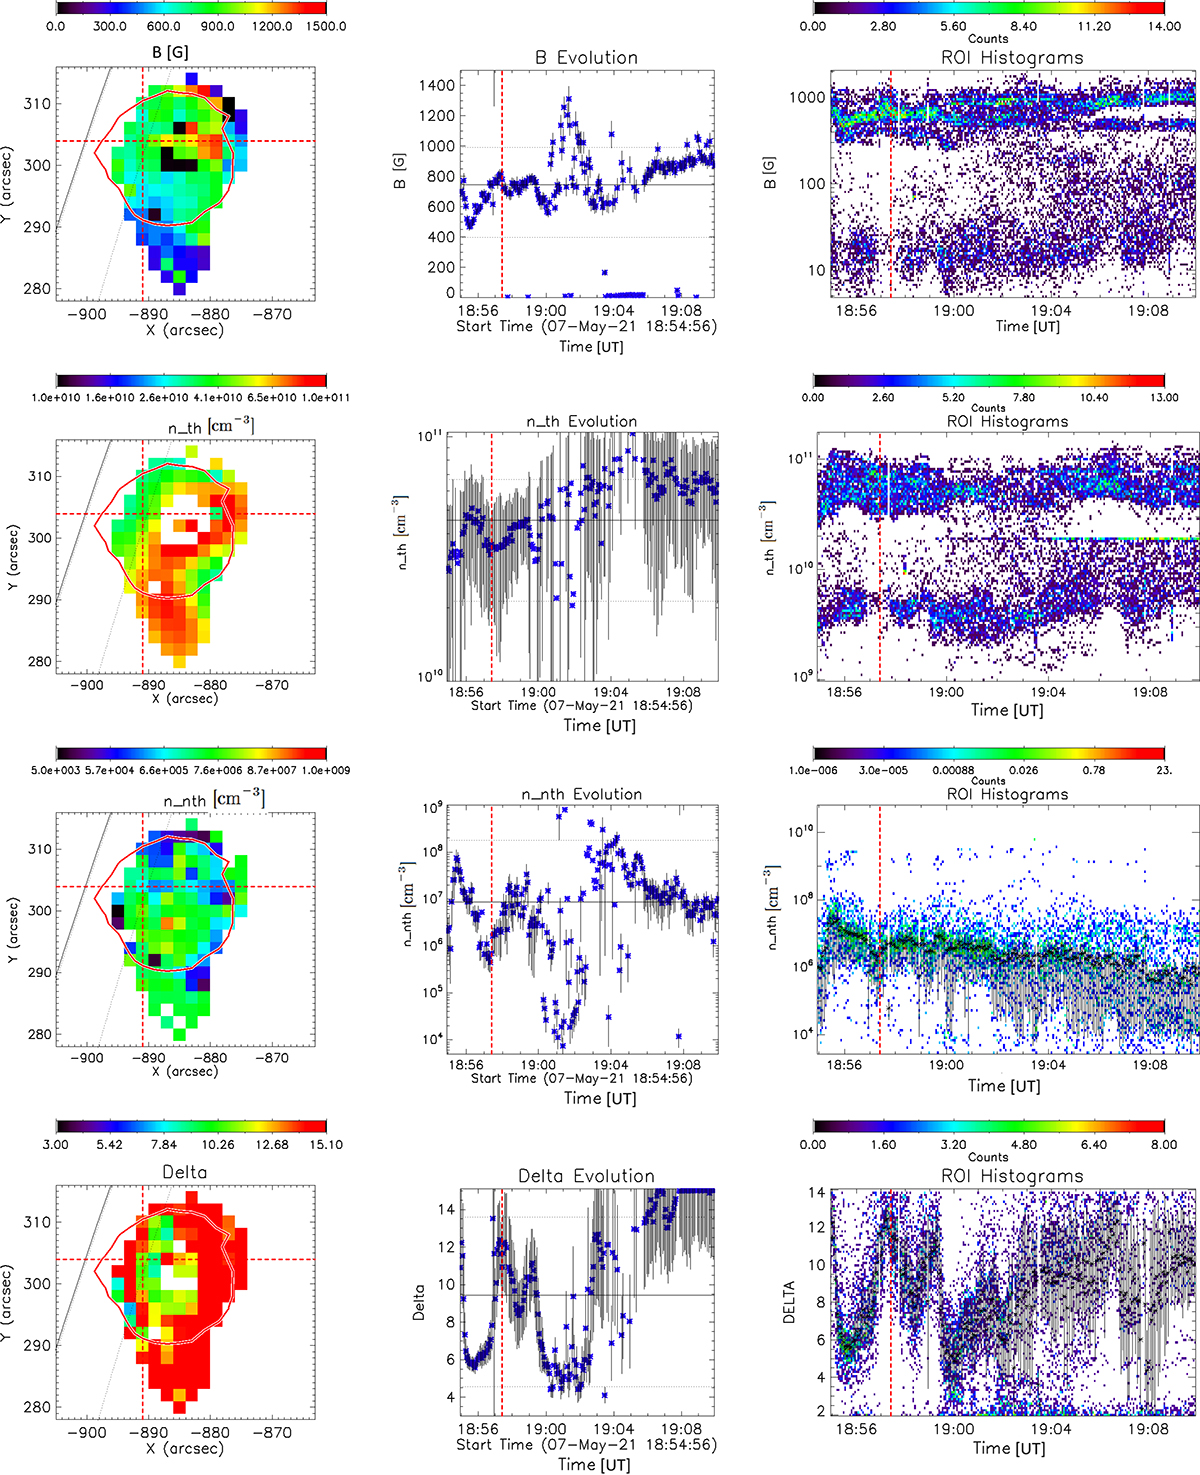
Fig. 5.
Download original image
Parameters inferred from the spectral model fitting and their evolution. Top row: Magnetic field strength. Second row: Thermal electron number density. Third row: Nonthermal electron number density. Bottom row: Nonthermal electron power-law index. Left column: Parameter maps corresponding to the same time frame (18:57:24 UT) as used in Fig. 4. Each map shows a region of interest (ROI) computed as a 20% contour (in red) of the XRT brightness for 18:57:08 UT. Middle column: Evolution of the fit parameters for the cursor-selected pixel (blue symbols) along with their corresponding median values (horizontal black lines). The selected pixel shown by a cursor in the left panels demonstrates smooth spectra and good spectral fits during the entire duration of the burst. Right column: Evolution of 2D histograms of the parameter distributions within the selected ROI during the entire flare duration. For the nonthermal parameters, evolution of the corresponding median values (symbols with error bars) are shown on top of the 2D histograms to aid the eye. In both the middle and right columns, vertical dotted red lines highlight the selected time frame of the maps displayed in the left column. A horizontal stripe in 2D histogram of the thermal density at nth ≈ 2 × 1010 cm−3 is an artifact, as explained in Fig. 6.
Current usage metrics show cumulative count of Article Views (full-text article views including HTML views, PDF and ePub downloads, according to the available data) and Abstracts Views on Vision4Press platform.
Data correspond to usage on the plateform after 2015. The current usage metrics is available 48-96 hours after online publication and is updated daily on week days.
Initial download of the metrics may take a while.