Open Access
Fig. 12.
Download original image
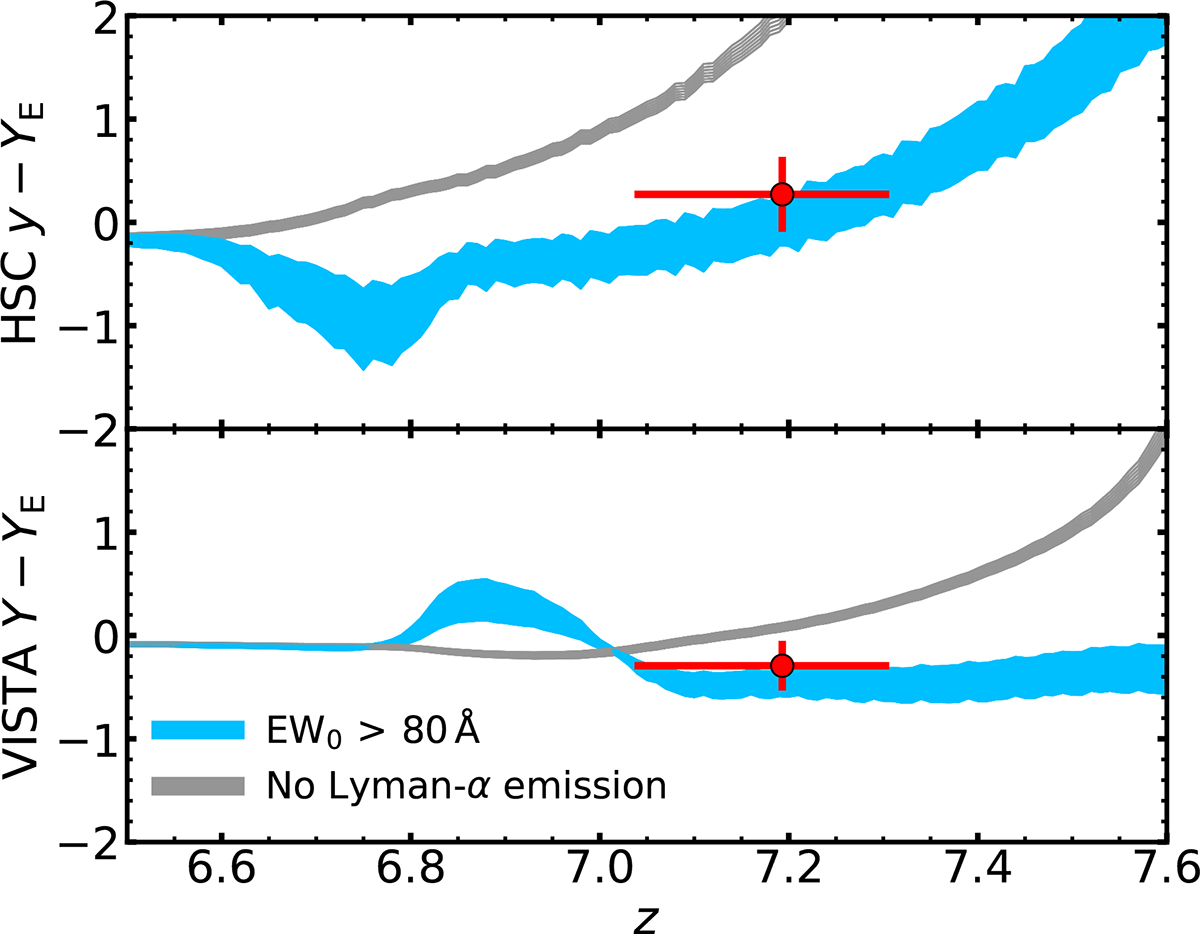
Expected HSC y − YE (top) and VISTA Y − YE colours (bottom) of LBGs (grey) and strong (EW0 > 80 Å) LAEs (blue) as a function of redshift, generated using mock BAGPIPES galaxies. The red point shows the position of our LAE candidate (see Fig. 13) in this colour-redshift space.
Current usage metrics show cumulative count of Article Views (full-text article views including HTML views, PDF and ePub downloads, according to the available data) and Abstracts Views on Vision4Press platform.
Data correspond to usage on the plateform after 2015. The current usage metrics is available 48-96 hours after online publication and is updated daily on week days.
Initial download of the metrics may take a while.