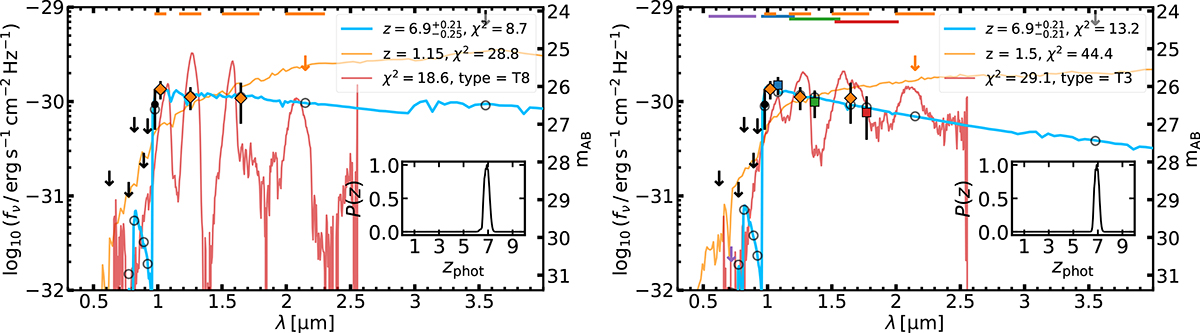
Fig. 3.
Download original image
Spectral energy distribution fitting of a candidate LBG, EUCL J100041.40+020157.5, at z = 6.90. Additional candidates are presented in Appendix C. Left: SED fitting without Euclid data as part of the U-only selection (see Sect. 3). Right: SED fitting including Euclid data as part of the U + E selection. The HSC, VISTA, and Euclid photometry are shown by the points, diamonds, and squares, respectively. The photometry is coloured following Fig. 1. Non-detections are replaced with 2σ upper limits. We also show the filter widths for VISTA and Euclid at the top of the plot. The Spitzer/IRAC model photometry and upper limit in the 3.6 μ filter is also shown. The blue curve shows the best high-redshift solution, and the grey open circles are its expected model photometry. The orange curve shows the best dusty low-redshift solution, and the red curve shows the best UCD solution. The legend in the top right shows the redshift and χ2 of the galaxy solutions, and the χ2 and spectral type of the UCD solution. The inset panel shows the redshift probability distribution for this source. The inclusion of Euclid data reinforces the exclusion of the UCD solution. We also note that the inclusion of Euclid data prefers a bluer slope.
Current usage metrics show cumulative count of Article Views (full-text article views including HTML views, PDF and ePub downloads, according to the available data) and Abstracts Views on Vision4Press platform.
Data correspond to usage on the plateform after 2015. The current usage metrics is available 48-96 hours after online publication and is updated daily on week days.
Initial download of the metrics may take a while.