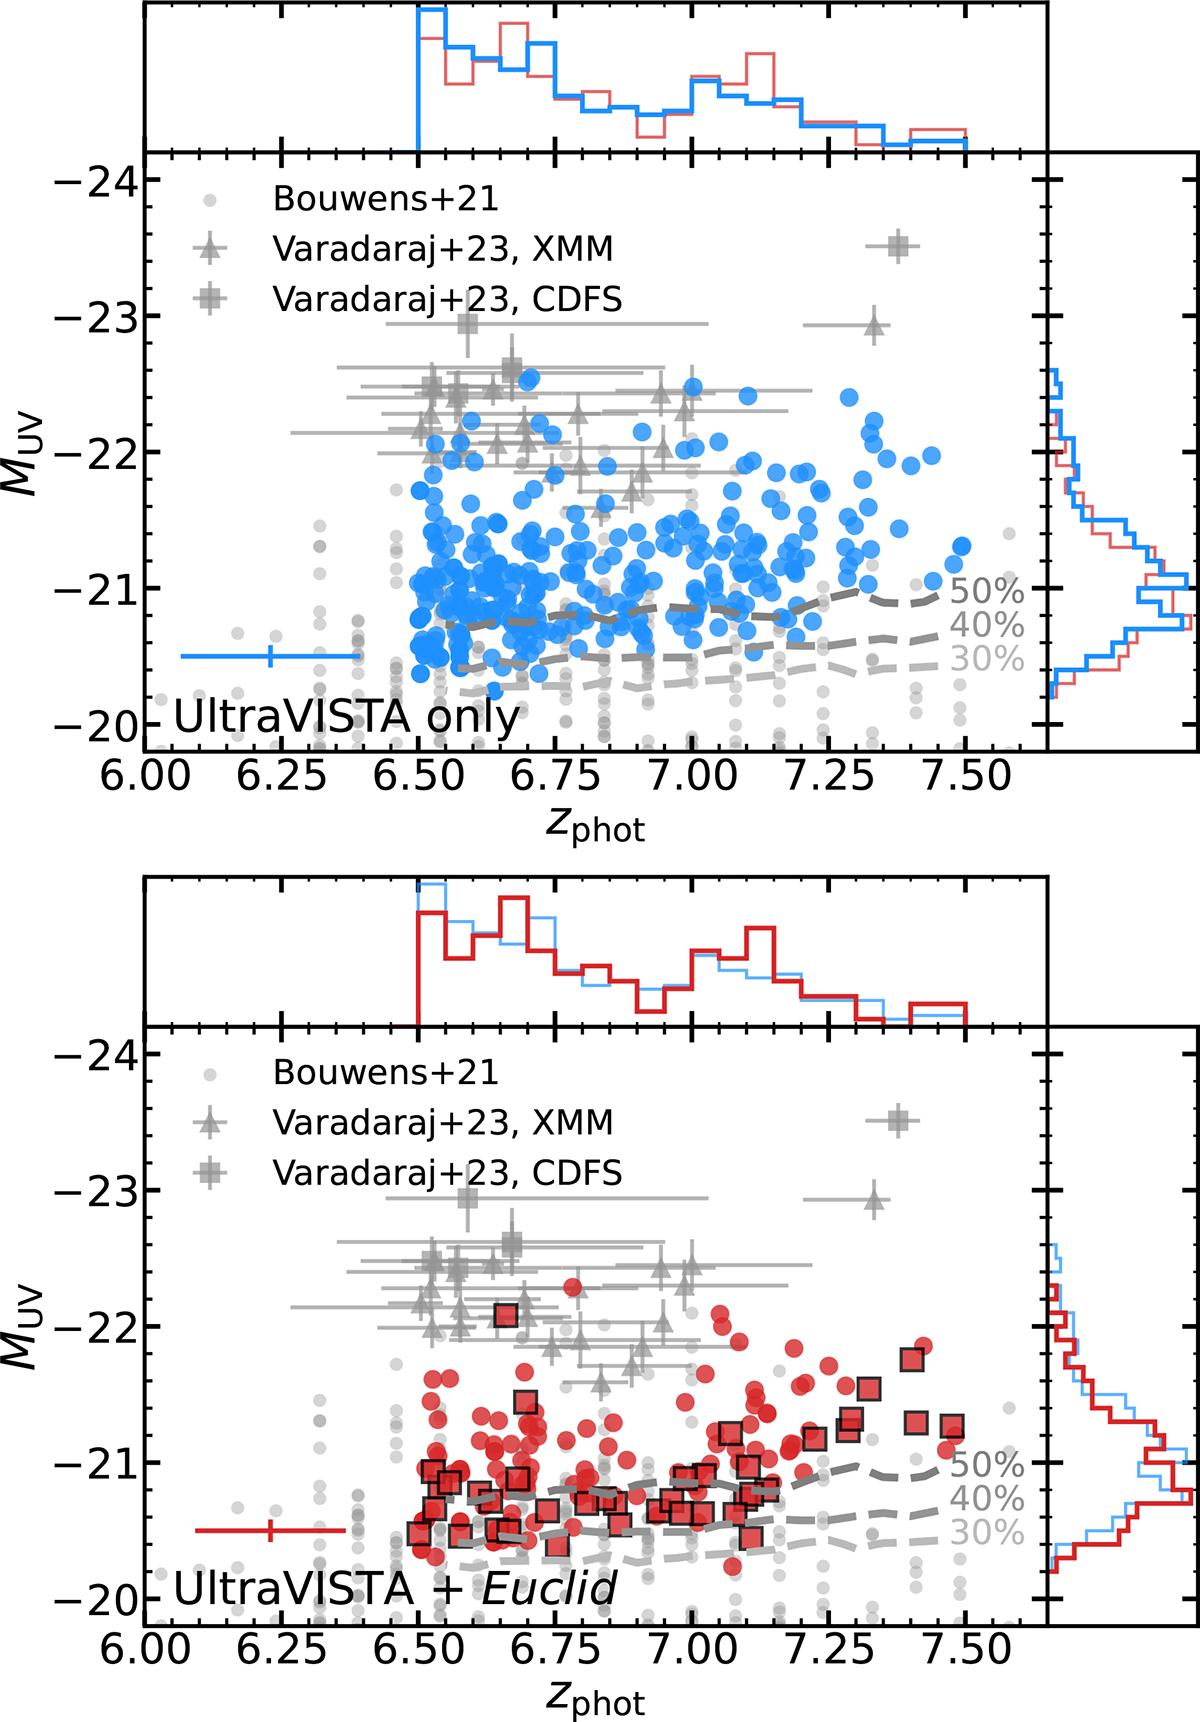
Fig. 4.
Download original image
Sample of LBGs at z ≃ 7 from this work plotted in photometric redshift (zphot) and absolute rest-frame UV magnitude (MUV) space. Top: U-only sample (blue). Bottom: U + E sample (red). The red squares with a black outline indicate galaxies not recovered in the U-only sample and thus unique to the U + E sample. In both panels, we also show the candidates from V23 in the XMM-LSS and ECDF-S fields, and the HST-selected candidates from B21. The dashed grey lines show the 30%, 40%, and 50% completeness limits, as derived from the injection-recovery simulation (see Sect. 5.1). We also show the marginalised distributions in zphot and MUV as normalised histograms, and also overplot the distribution of the other sample as the thinner, fainter line for comparison. The mean uncertainties are shown on the bottom left.
Current usage metrics show cumulative count of Article Views (full-text article views including HTML views, PDF and ePub downloads, according to the available data) and Abstracts Views on Vision4Press platform.
Data correspond to usage on the plateform after 2015. The current usage metrics is available 48-96 hours after online publication and is updated daily on week days.
Initial download of the metrics may take a while.