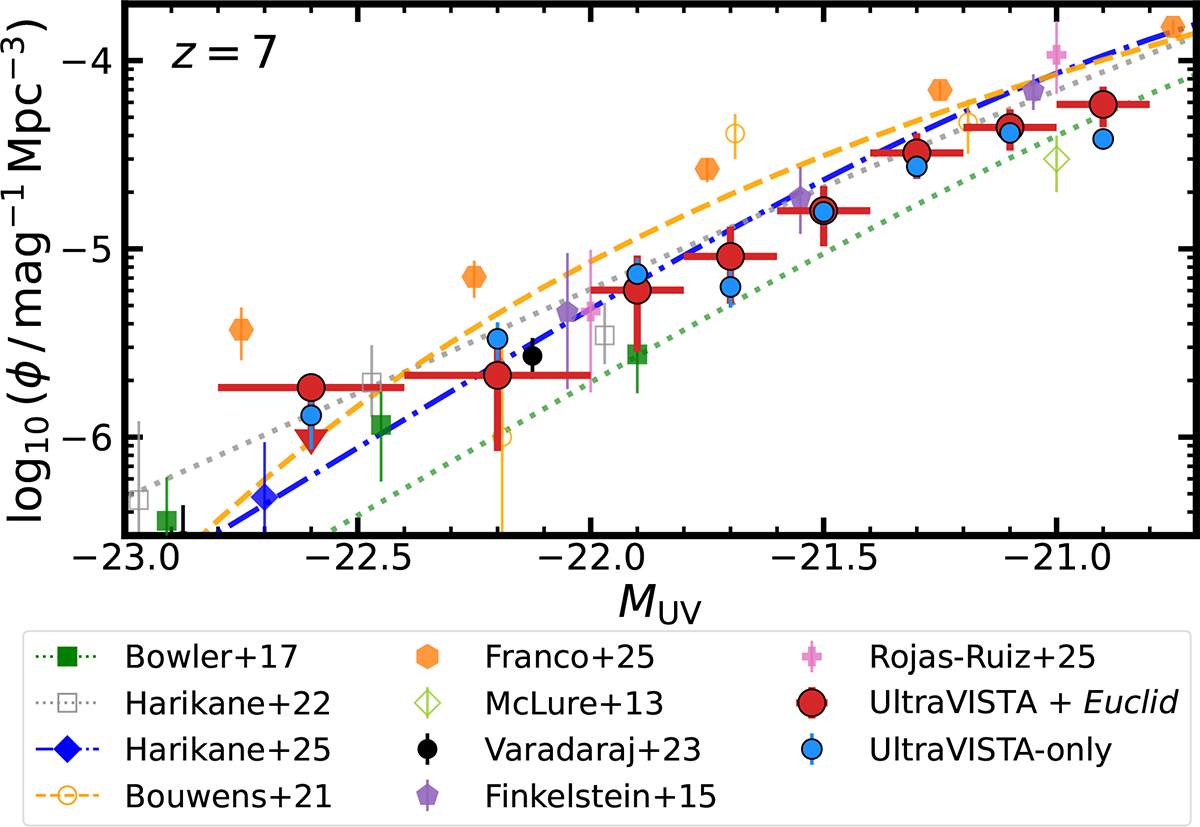
Fig. 5.
Download original image
Comparison of the UV LF at z ≃ 7 measured with the two samples presented in Fig. 4 and Sect. 4. The smaller blue circles show the LF points calculated from the U-only sample. The larger red circles show the LF points calculated from the U + E sample. We used the same binning in both cases, and the LF values are presented in Table 4. The brightest bin contains no galaxies from the U + E sample, so we show a 1σ upper limit whose value is noted in Table 4. We show results from McLure et al. (2013), F15, B17, B21 (6.3 < z < 7.3), Harikane et al. (2022, 6.3 < z < 7.7), V23, Harikane et al. (2025), and Franco et al. (2025, 5.5 < z < 8.5). Unless otherwise stated, these LFs are measured at 6.5 < z < 7.5. Also shown are the best-fit Schechter and DPL fits found by B21 and Harikane et al. (2025) respectively.
Current usage metrics show cumulative count of Article Views (full-text article views including HTML views, PDF and ePub downloads, according to the available data) and Abstracts Views on Vision4Press platform.
Data correspond to usage on the plateform after 2015. The current usage metrics is available 48-96 hours after online publication and is updated daily on week days.
Initial download of the metrics may take a while.