Fig. 6.
Download original image
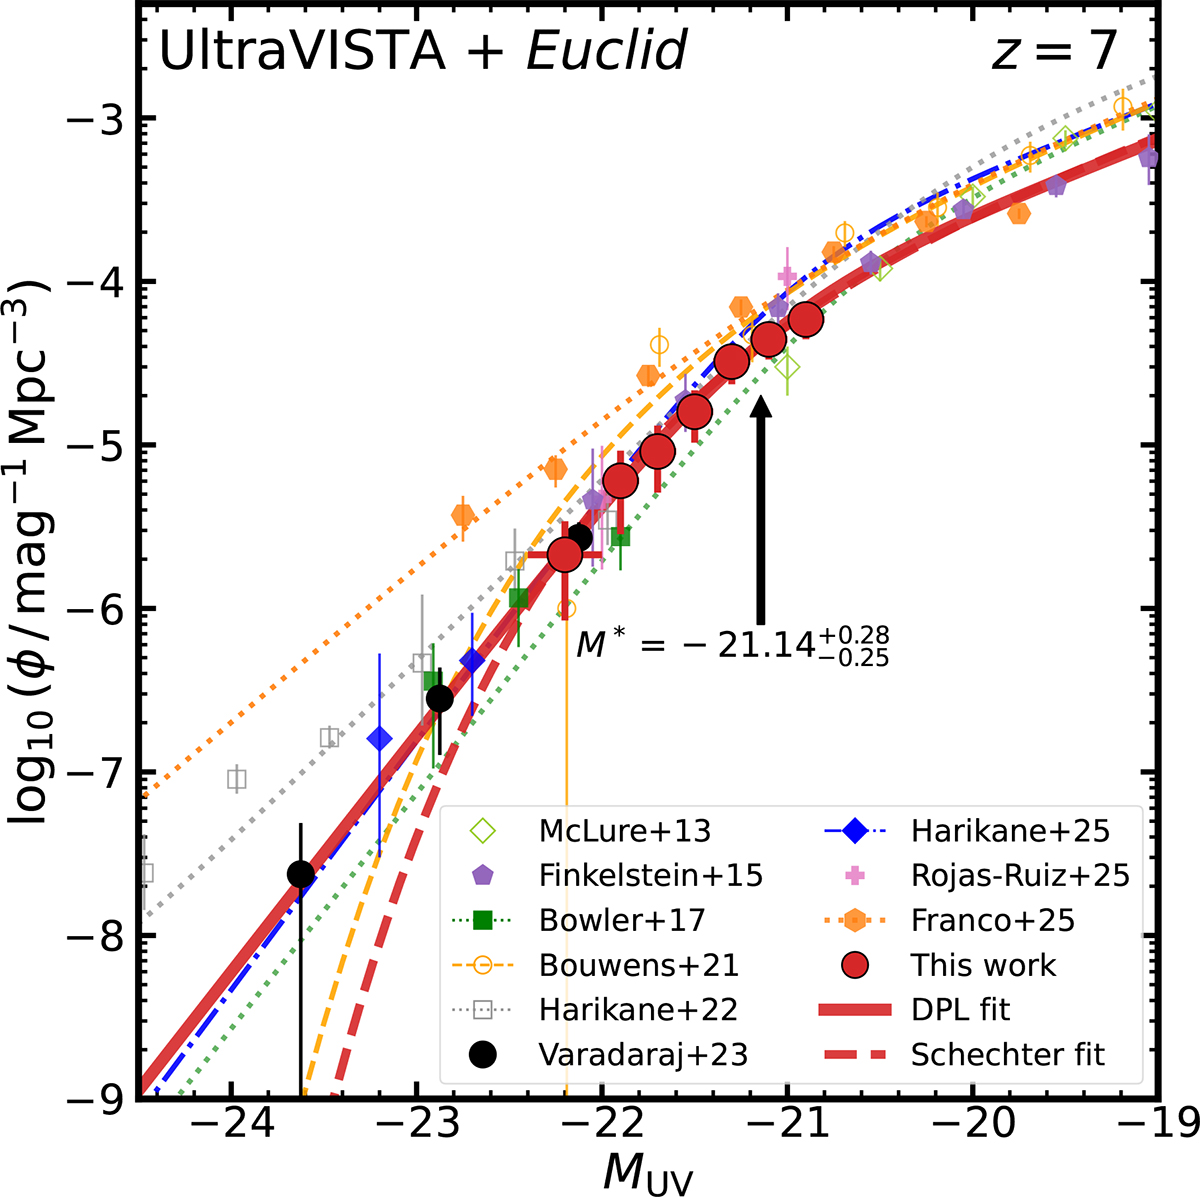
Best-fit DPL and Schechter function for the UV LF at z ≃ 7 shown by the solid and dashed red lines, respectively. For the fitting, we used results from this work (red points, the U + E sample), bright-end results from V23 (black points), and faint-end results from F15 (purple pentagons). We also show results at 6.5 < z < 7.5 (unless otherwise stated) from McLure et al. (2013), F15, B17, B21 (6.3 < z < 7.3), Harikane et al. (2022, 6.3 < z < 7.7), Harikane et al. (2025), Franco et al. (2025, 5.5 < z < 8.5), and Rojas-Ruiz et al. (2025, 7 < z ≤ 8.4). For comparison to our fit, we plot the best-fit DPLs from B17, Harikane et al. (2022), and Harikane et al. (2025).
Current usage metrics show cumulative count of Article Views (full-text article views including HTML views, PDF and ePub downloads, according to the available data) and Abstracts Views on Vision4Press platform.
Data correspond to usage on the plateform after 2015. The current usage metrics is available 48-96 hours after online publication and is updated daily on week days.
Initial download of the metrics may take a while.