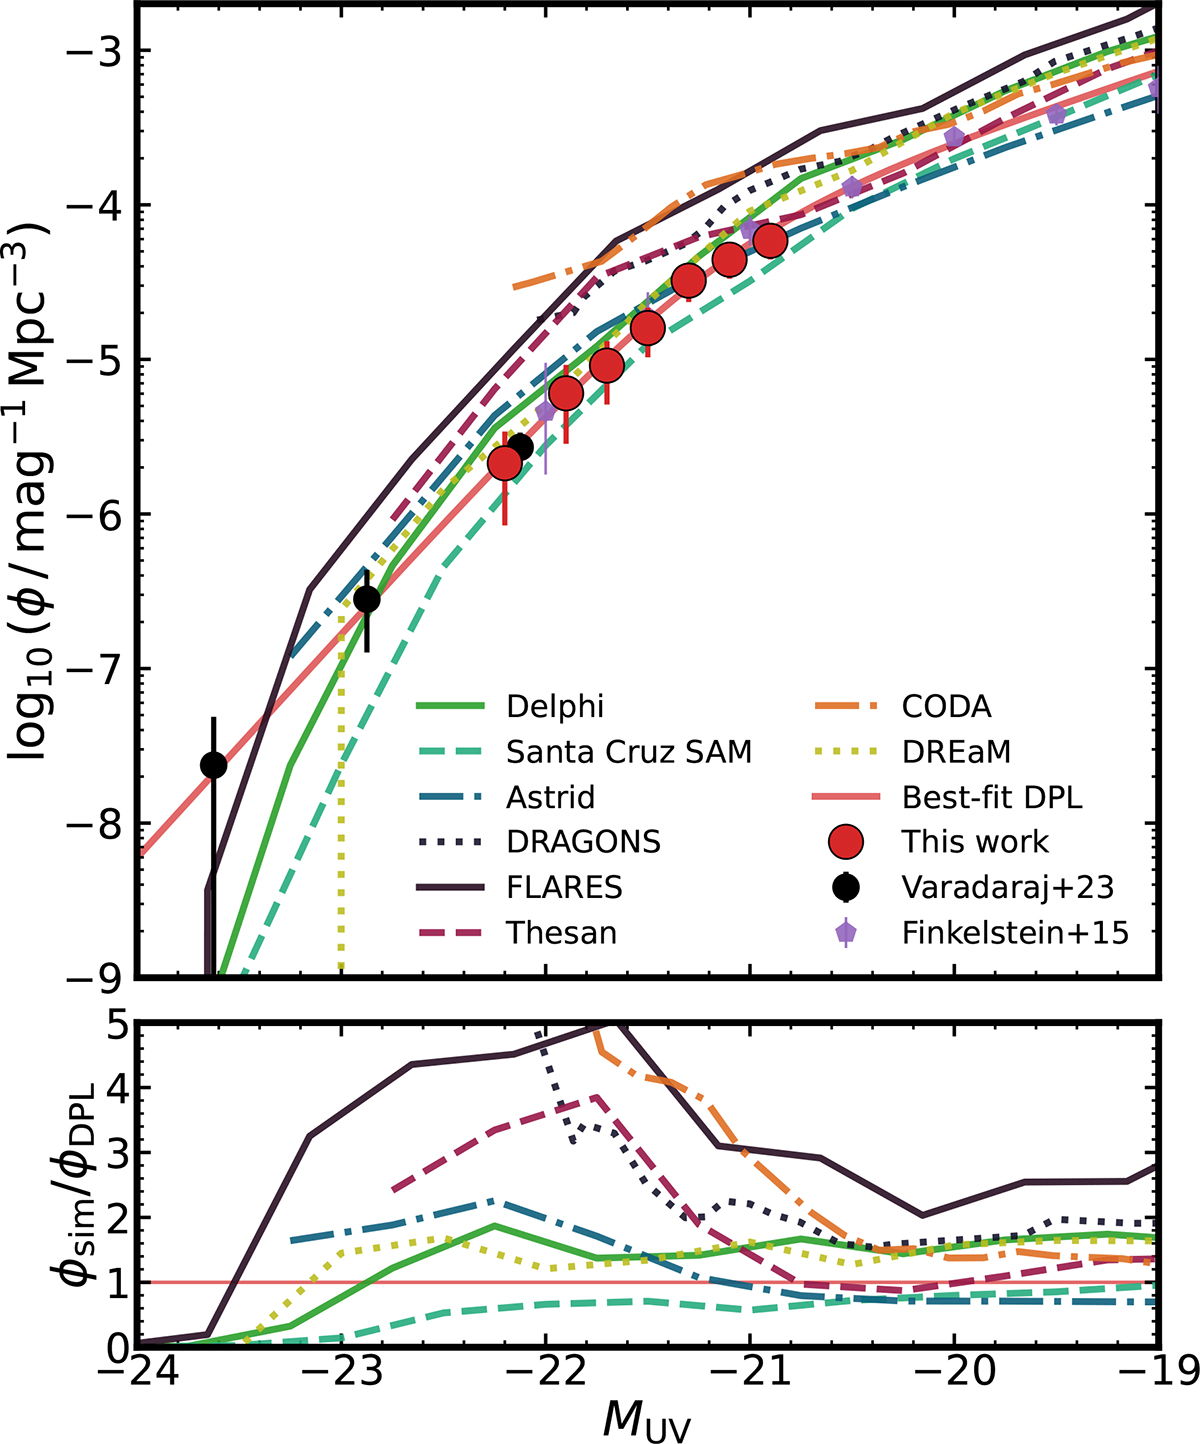
Fig. 7.
Download original image
Comparison of the UV LF measured in this work with predictions from semi-analytic models and hydrodynamic simulations. (See Sect. 5.6 for an outline of the studies.) We also show LF results from V23 and F15. We show our best-fit DPL with the red line. The bottom panel shows the ratio of the LF predictions to our best-fit DPL, as a function of MUV.
Current usage metrics show cumulative count of Article Views (full-text article views including HTML views, PDF and ePub downloads, according to the available data) and Abstracts Views on Vision4Press platform.
Data correspond to usage on the plateform after 2015. The current usage metrics is available 48-96 hours after online publication and is updated daily on week days.
Initial download of the metrics may take a while.