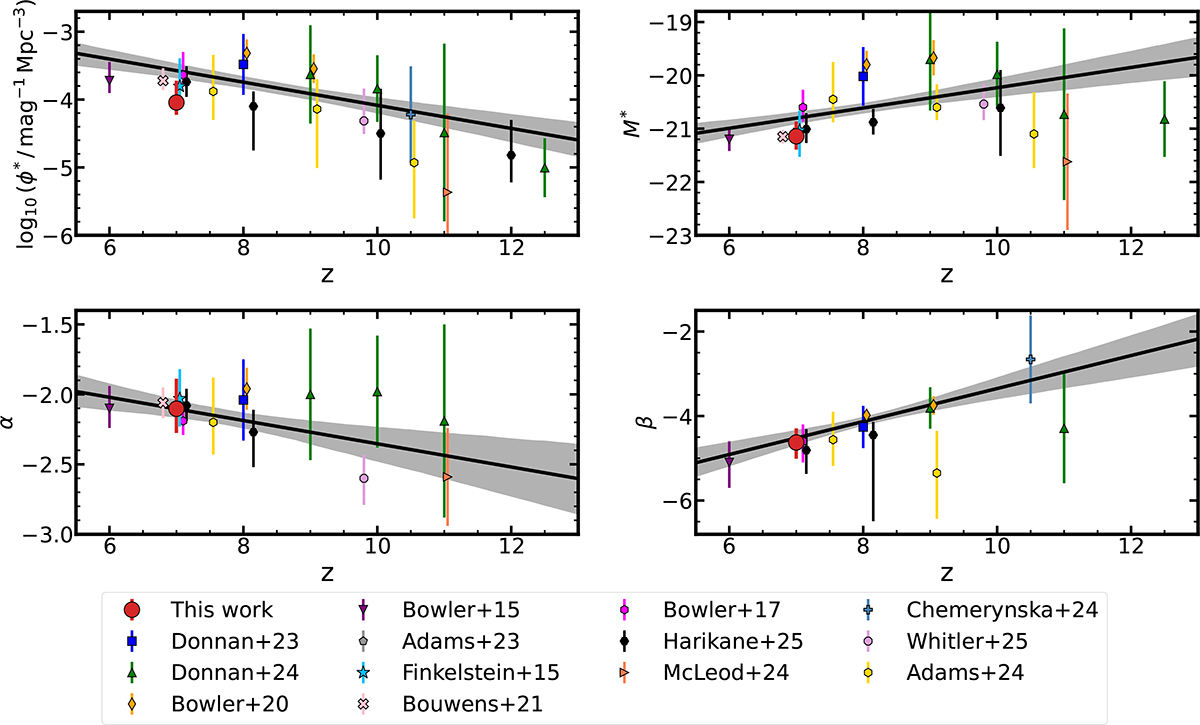
Fig. 8.
Download original image
Evolution of the DPL parameters with redshift, namely the normalisation, ϕ*; the characteristic magnitude, M*; the faint-end slope, α; and the bright-end slope, β (see Eq. (3)). The red points show the parameters derived from the DPL fitting in this work. We show a compilation of results at z = 6–12.5 from Bowler et al. (2015, 2020), B17, Adams et al. (2023, 2024), Donnan et al. (2023, 2024), Chemerynska et al. (2024), McLeod et al. (2024), Harikane et al. (2025), and Whitler et al. (2025) with some slight offsets in redshift for clarity. We do not show points from these studies that were fixed during the DPL fitting. For β, we only show studies which have at least two LF points brighter than their M*, meaning they have some constraints on the bright-end slope. The black line indicates the best-fit straight-line to the z ≥ 6 data. We also show the results of Schechter fitting from F15 and B21 for ease of comparison in Sect. 5.4.
Current usage metrics show cumulative count of Article Views (full-text article views including HTML views, PDF and ePub downloads, according to the available data) and Abstracts Views on Vision4Press platform.
Data correspond to usage on the plateform after 2015. The current usage metrics is available 48-96 hours after online publication and is updated daily on week days.
Initial download of the metrics may take a while.