Fig. 9.
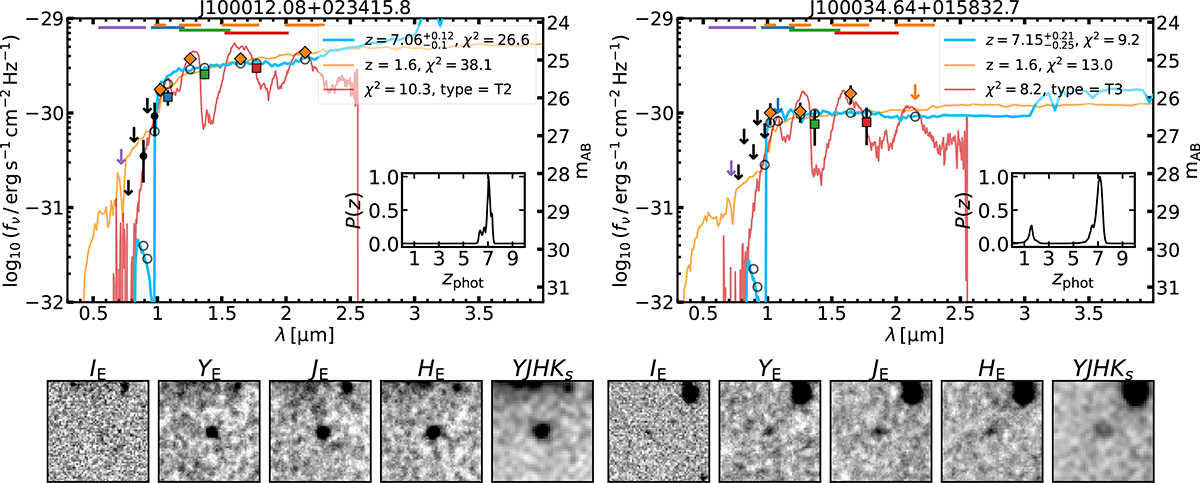
Download original image
Spectral energy distribution fitting and postage stamp cutouts (in Euclid and a VISTA YJHKs stack) of two candidate T-type UCDs. Left: Brighter UCD with mAB = 25. Right: Fainter UCD with mAB = 26. As in Fig. 3, the orange diamonds represent the UltraVISTA photometry. The coloured squares show the Euclid photometry, with the IE non-detection replaced with a 2σ upper limit. The remaining HSC photometry is shown by the black points. The coloured horizontal lines indicate the Euclid ad VISTA filter widths. The blue, orange, and red curves represent the high-redshift LBG, low-redshift dusty galaxy, and UCD solutions, respectively. The postage stamp cutouts are 6″ × 6″ and are scaled to saturate at 2σ below and 5σ above the noise level. Note the clear molecular absorption features seen by the VISTA + Euclid NIR photometry at λ > 1 μ. Also note the PSF-like morphology for the bright source, but a more irregular morphology for the faint source driven by noise.
Current usage metrics show cumulative count of Article Views (full-text article views including HTML views, PDF and ePub downloads, according to the available data) and Abstracts Views on Vision4Press platform.
Data correspond to usage on the plateform after 2015. The current usage metrics is available 48-96 hours after online publication and is updated daily on week days.
Initial download of the metrics may take a while.