Fig. 2.
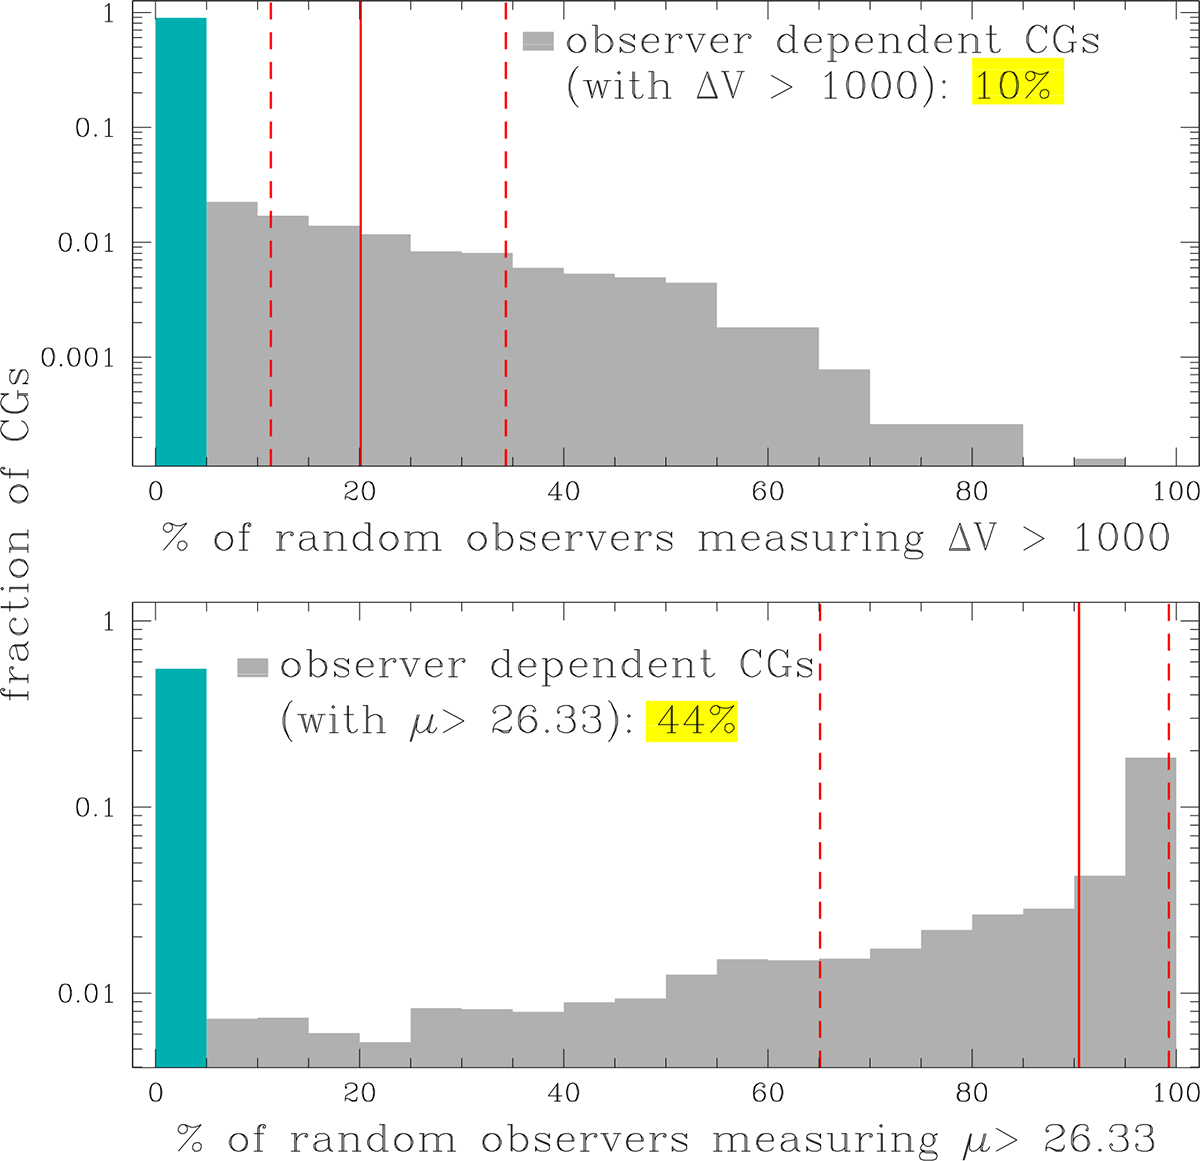
Download original image
Distribution among the 7709 CGs of the percentage of 1000 virtual observers seeing the CG fail the selection criteria. Top panel: Percentage of all-sky observers who lose the CGs because of the radial velocity filter. Bottom panel: Same but when analysing the compactness criterion (surface brightness, μ). The inset yellow legends in both panels quote the percentage of the total sample of CGs that are lost for at least 5% of randomly orientated observers. Vertical red lines represent the medians (solid) and the 25th and 75th percentiles (dashed) of the distributions for the observer-dependent CGs (grey histograms). The teal bar between 0 and 5% represents the fraction of CGs that are considered robust.
Current usage metrics show cumulative count of Article Views (full-text article views including HTML views, PDF and ePub downloads, according to the available data) and Abstracts Views on Vision4Press platform.
Data correspond to usage on the plateform after 2015. The current usage metrics is available 48-96 hours after online publication and is updated daily on week days.
Initial download of the metrics may take a while.