Fig. 3.
Download original image
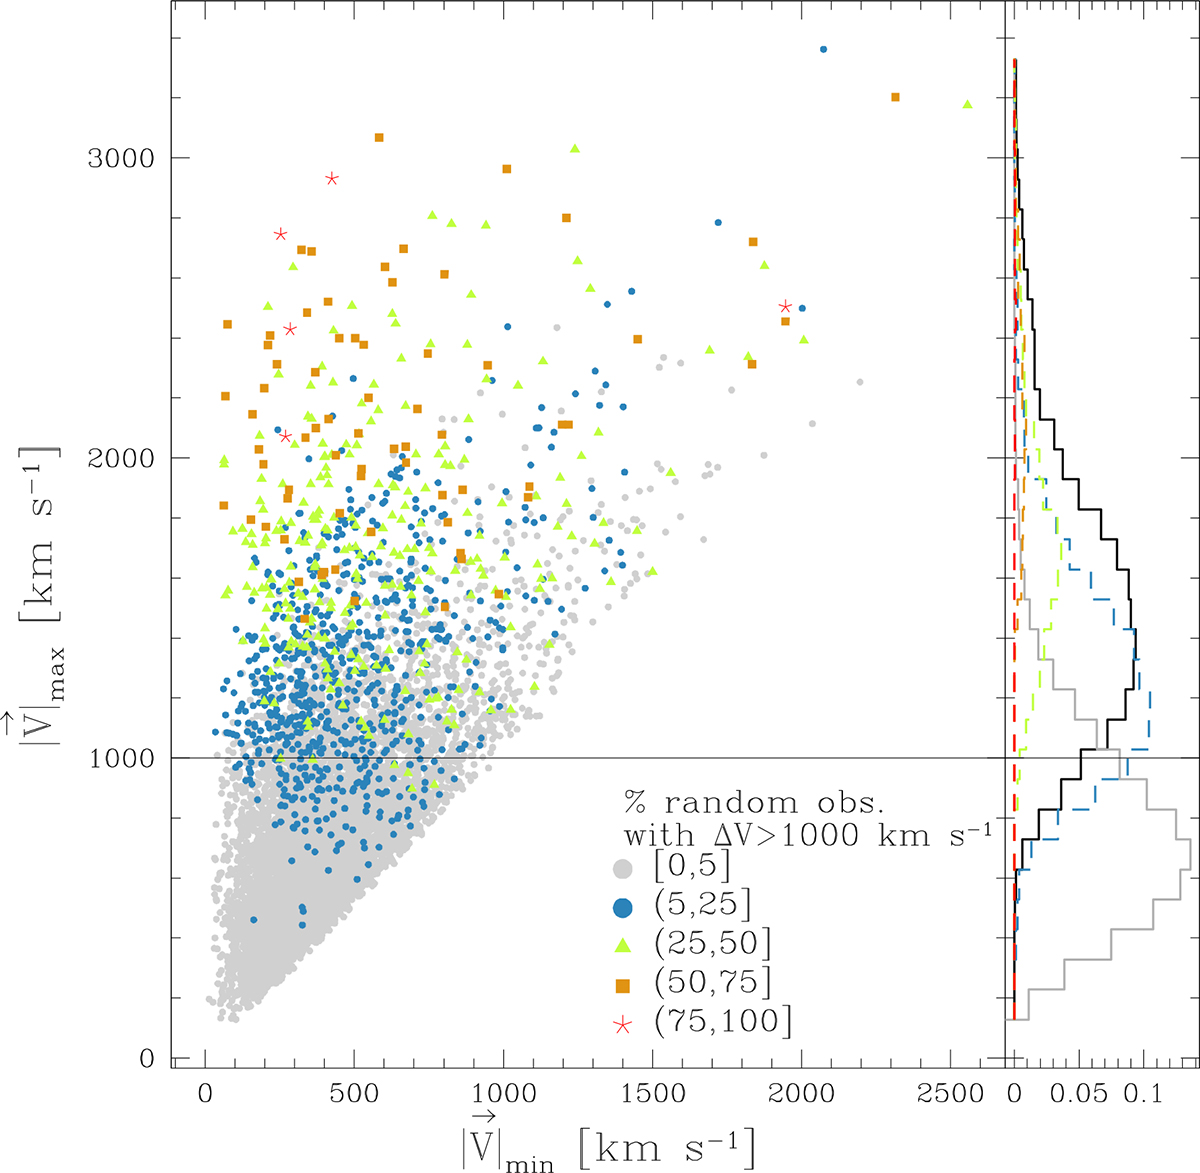
Scatter plot of the maximum and minimum galaxy peculiar velocity moduli for each CG. The grey dots represent the sample of CGs that are lost by fewer than 5% of the observers when applying the velocity filter, while the coloured dots are the sample of CGs that are lost for larger percentages of random observers. Different colours represent different percentages of observers who lose each CG (inset legends). The right panel displays the histograms of the maximum velocity moduli for non-lost CGs in grey and lost CGs in black (the coloured histograms are sub-samples of the black).
Current usage metrics show cumulative count of Article Views (full-text article views including HTML views, PDF and ePub downloads, according to the available data) and Abstracts Views on Vision4Press platform.
Data correspond to usage on the plateform after 2015. The current usage metrics is available 48-96 hours after online publication and is updated daily on week days.
Initial download of the metrics may take a while.