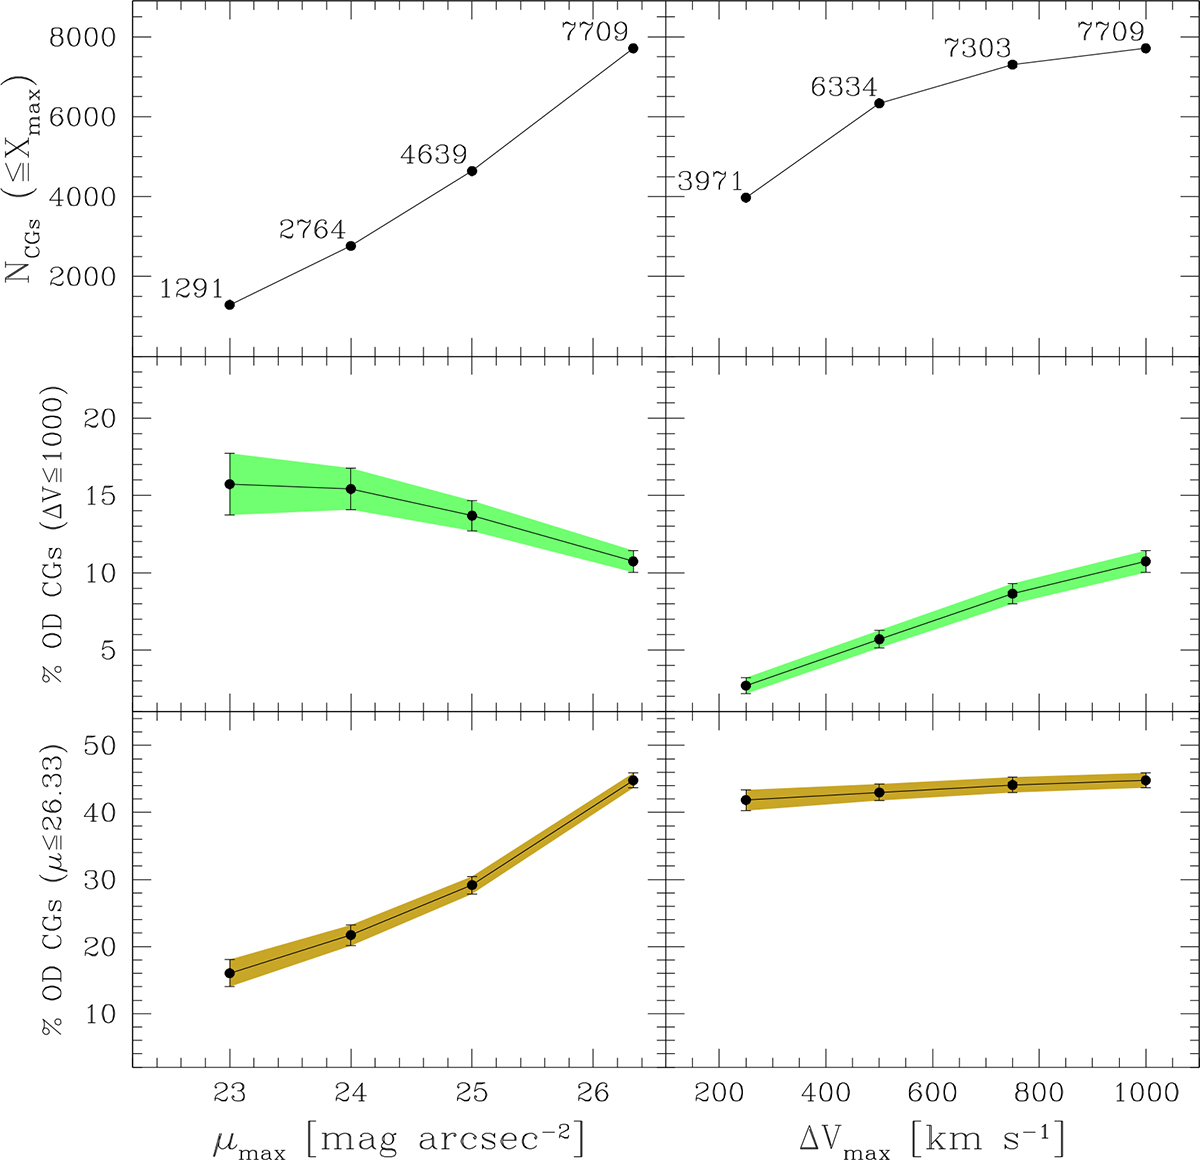
Fig. 5.
Download original image
Percentage of observer-dependent (OD) CGs for four different sub-samples defined by varying the maximum surface brightness or the velocity gap in the line of sight. The left column shows the number of CGs (top panel), the percentages of CGs that are lost due to the velocity filter (middle panel), and μ criterion (bottom panel) as a function of the original μmax of the CG, i.e. each bin only takes into account CGs with an original μ less than the corresponding bin value (μ ≤ μmax). The right column shows the same as the left column, but for samples selected as a function of the maximum velocity difference of galaxy members from the CG centre (ΔV ≤ ΔVmax). In each case, the last bin corresponds to the original values of μlim and ΔVlim of the CG sample.
Current usage metrics show cumulative count of Article Views (full-text article views including HTML views, PDF and ePub downloads, according to the available data) and Abstracts Views on Vision4Press platform.
Data correspond to usage on the plateform after 2015. The current usage metrics is available 48-96 hours after online publication and is updated daily on week days.
Initial download of the metrics may take a while.