Fig. 6.
Download original image
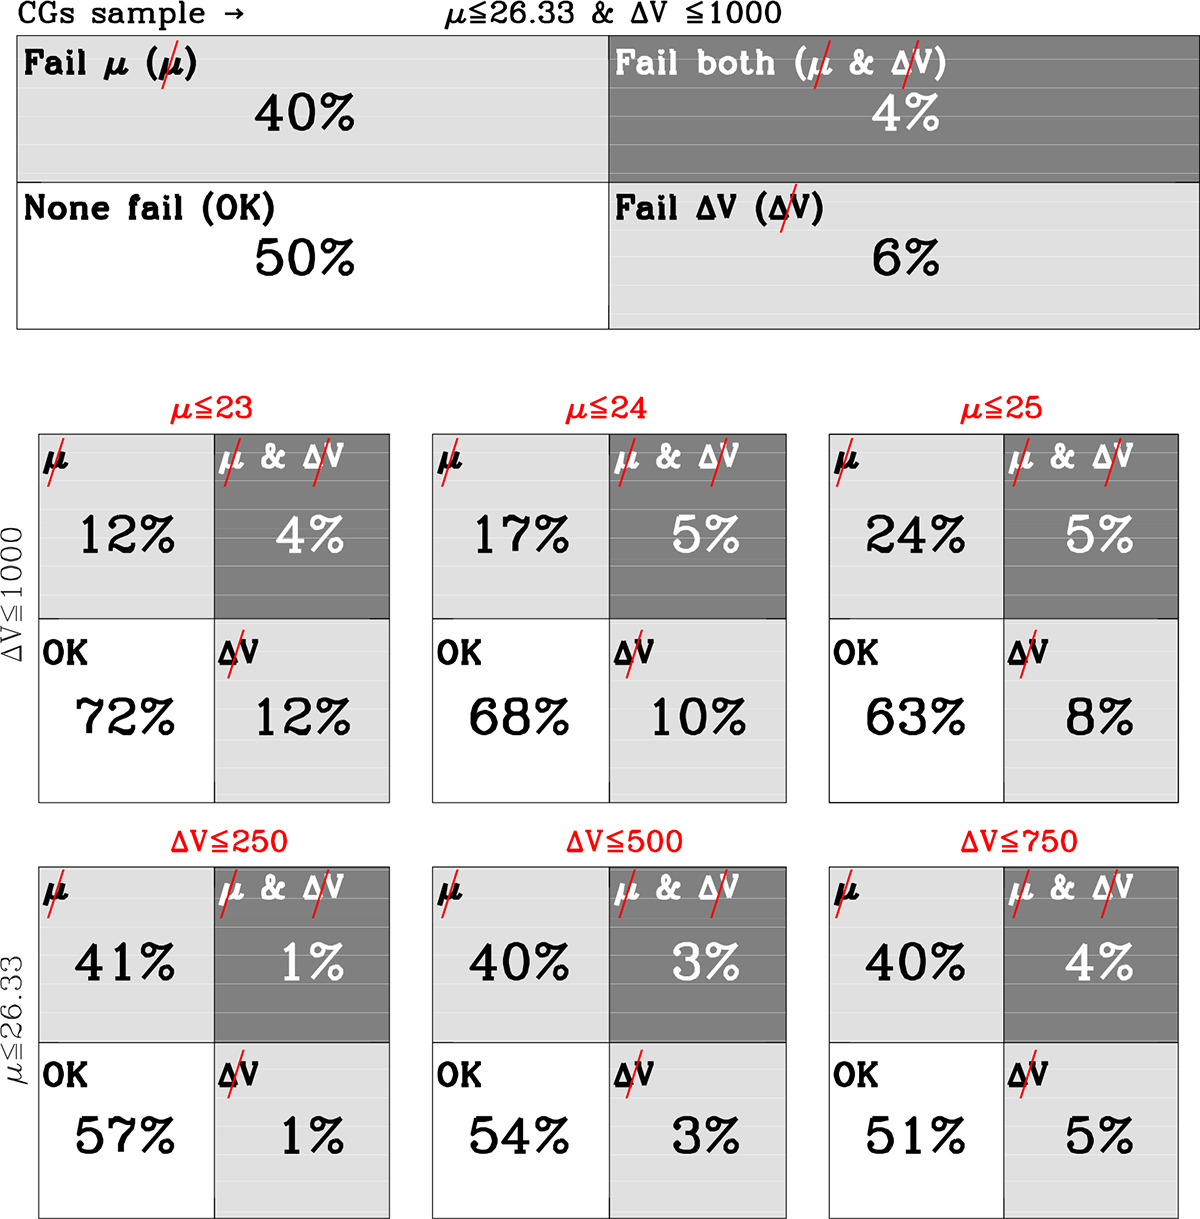
Percentages of CGs obtained when analysing the joint effect of whether an observer may or may not miss a CG due to surface brightness, velocity gap, or both. Dark grey areas highlight the percentage of CGs that random observers have lost due to the failure of both criteria, while light grey areas display the percentages obtained when the CGs are lost by exceeding the limits in surface brightness (26.33) or velocity gap (1000). Finally, white areas quote the percentage of CGs that are identified by at least 95% of the random observers, regardless of their point of view. The top panel displays the percentages for the full sample of CGs, while the middle and bottom panels quote the percentages when different sub-samples are defined as a function of the surface brightness or the velocity gap, respectively.
Current usage metrics show cumulative count of Article Views (full-text article views including HTML views, PDF and ePub downloads, according to the available data) and Abstracts Views on Vision4Press platform.
Data correspond to usage on the plateform after 2015. The current usage metrics is available 48-96 hours after online publication and is updated daily on week days.
Initial download of the metrics may take a while.