Fig. 7.
Download original image
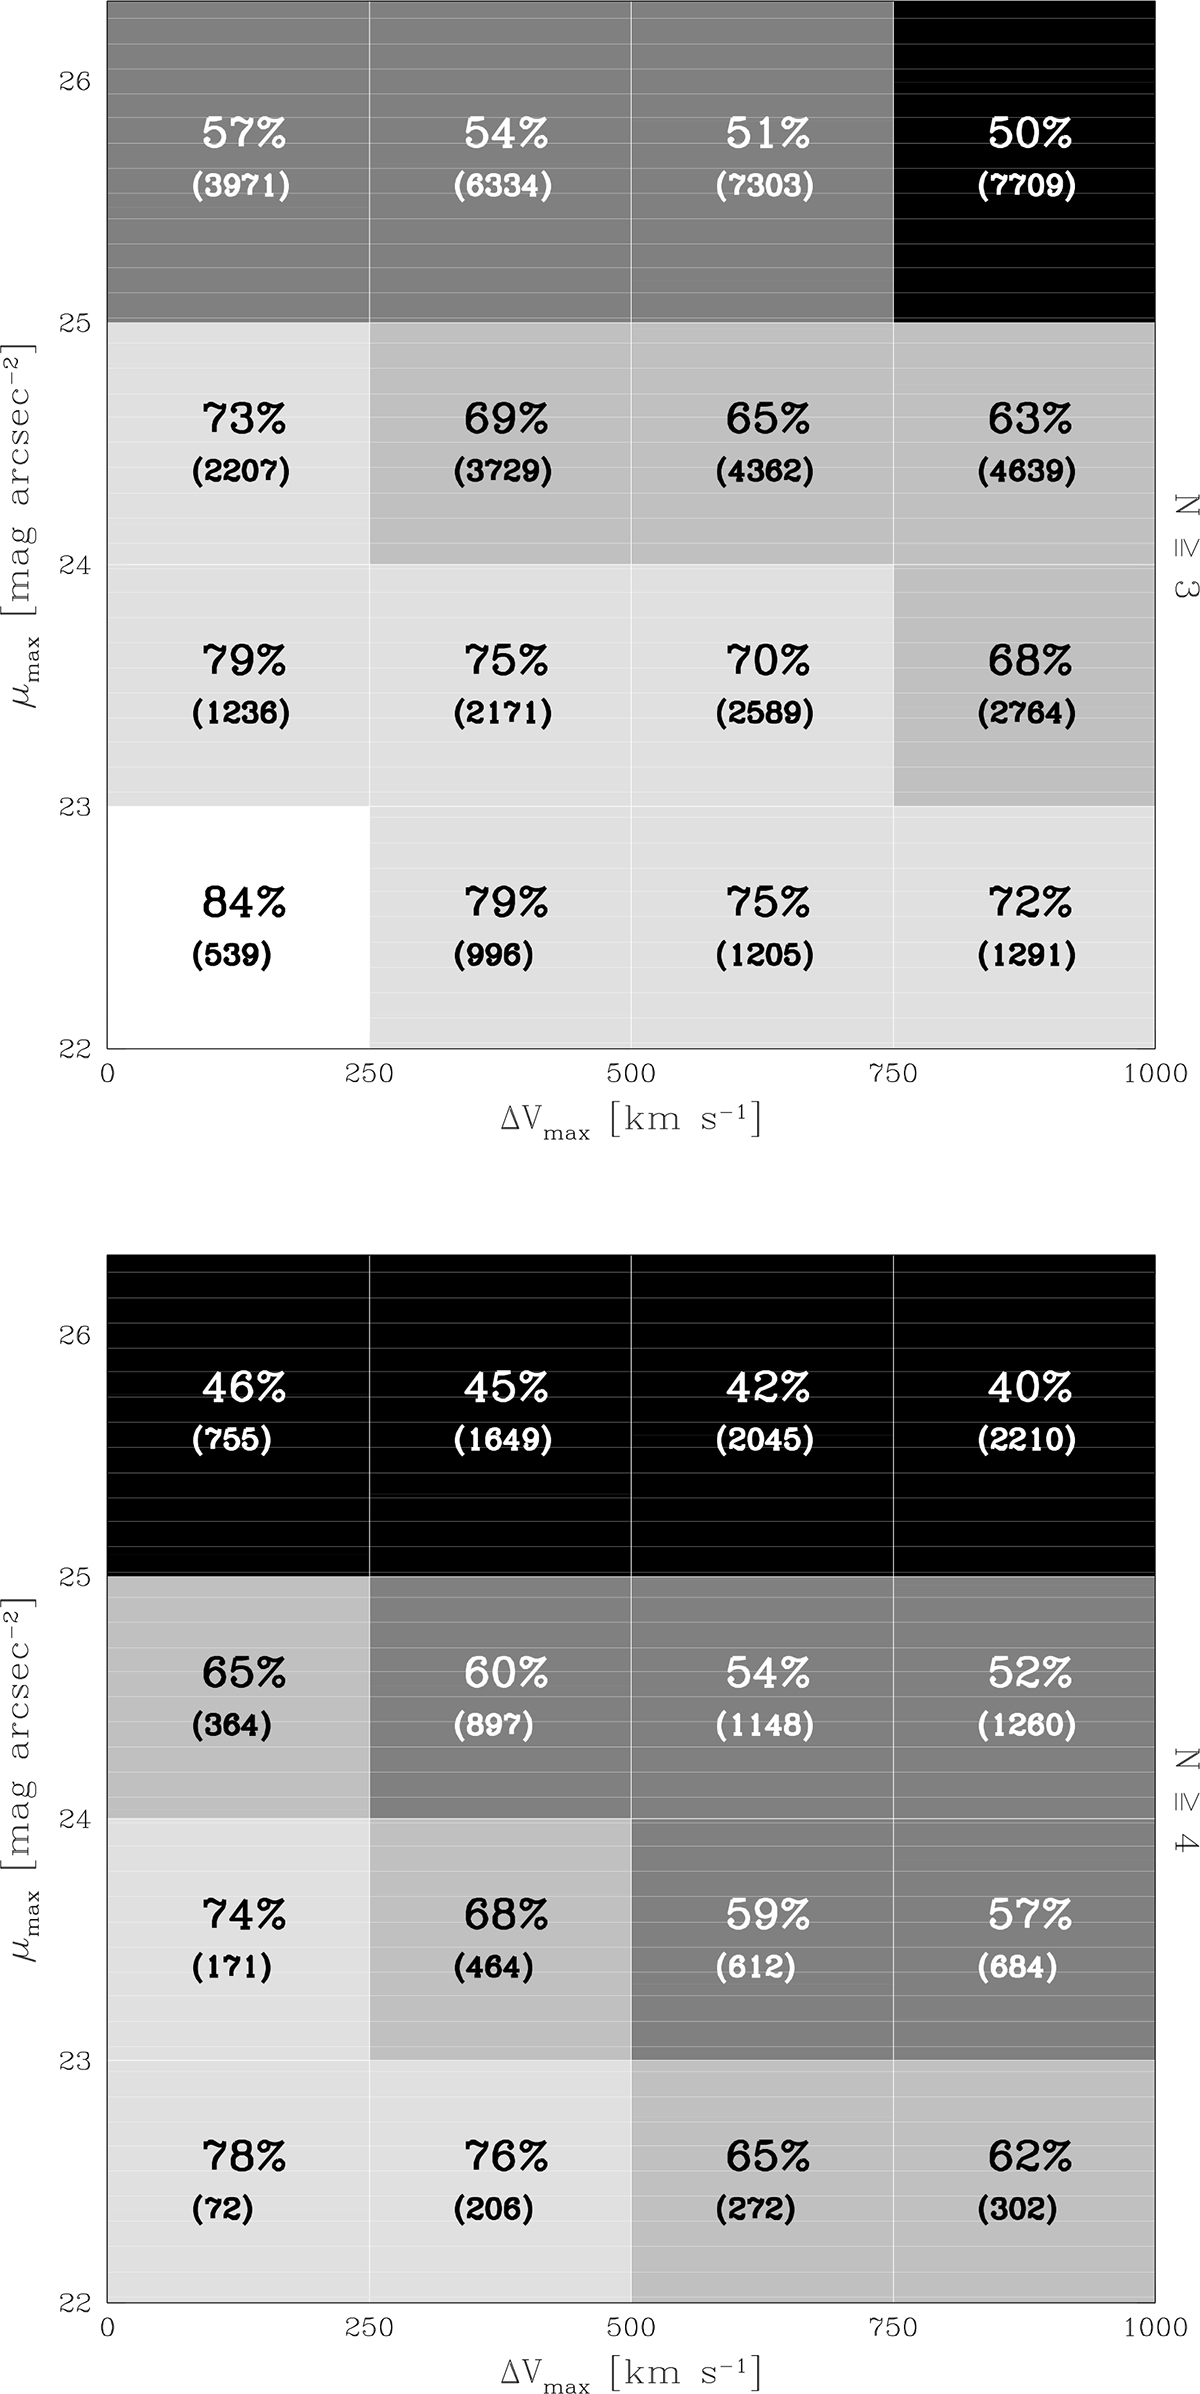
Percentage of robust CGs in ΔVmax − μmax space that have been observed for over 95% of the random observers, regardless of their point of view. Each box in this space represents a different CG sub-sample selected with a different ΔVmax and μmax limits. For instance, the bottom-left box represents the sub-sample with μ ≤ 23 and ΔV ≤ 250, while the top-right rectangle displays the percentage for the full sample of CGs. Each panel also quotes the total number of CGs (in parentheses) in each resulting sub-sample. Colours are assigned in a five-level greyscale, ranging from the lowest (black) to the highest (white) percentages. The upper plot is performed with CGs with three or more members, while the bottom plot only includes CGs with four or more galaxy members.
Current usage metrics show cumulative count of Article Views (full-text article views including HTML views, PDF and ePub downloads, according to the available data) and Abstracts Views on Vision4Press platform.
Data correspond to usage on the plateform after 2015. The current usage metrics is available 48-96 hours after online publication and is updated daily on week days.
Initial download of the metrics may take a while.