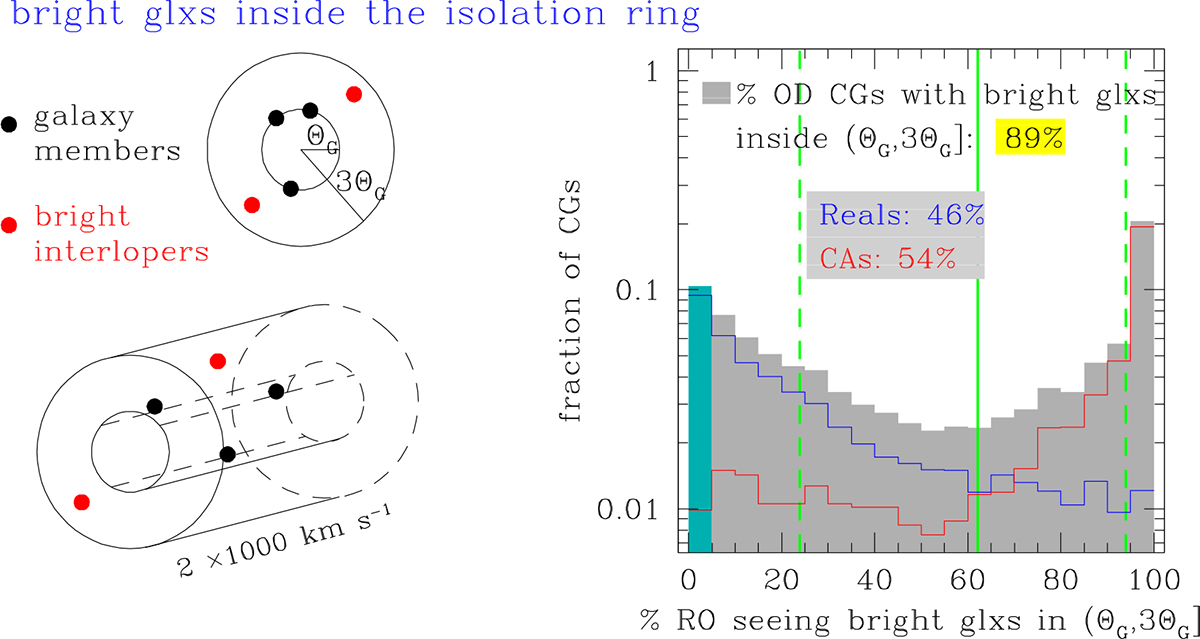
Fig. 9.
Download original image
Bright galaxy interlopers inside the isolation ring, (ΘG,3ΘG], for different random observers. Left panel: Schematic representation of galaxy members and bright interlopers detected by a random observer within the isolation ring. Right panel: Distribution among the 7488 CGs of the percentages of random observers (RO) who detected interlopers. Inset legends quote the percentages of observer-dependent (OD) CGs due to the detection of bright interlopers in this case. Vertical green lines represent the medians (solid) and the 25th and 75th percentiles (dashed) of the distribution for the observer-dependent CGs (grey histograms). The teal bar between 0 and 5% represents the fraction of CGs considered robust. We also display the distributions for CGs classified originally as Reals (blue) and CA+Fake (red) and quote the percentages of these classes of systems with respect to the sample of observer-dependent CGs.
Current usage metrics show cumulative count of Article Views (full-text article views including HTML views, PDF and ePub downloads, according to the available data) and Abstracts Views on Vision4Press platform.
Data correspond to usage on the plateform after 2015. The current usage metrics is available 48-96 hours after online publication and is updated daily on week days.
Initial download of the metrics may take a while.