Fig. A.1
Download original image
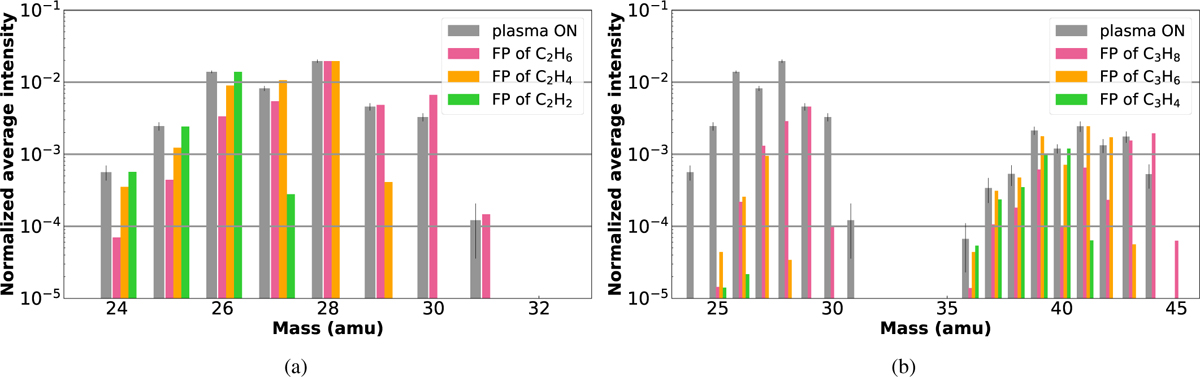
Mass spectrum of an irradiated gas mixture of 95% H2 + 5% CH4 (Gray). Fragmentation patterns (FP) of the two-carbon atoms (A.1a) and three-carbon atoms (A.1b) compounds (Pink for the alkanes, orange for the alkenes, green for the alkynes). Each FP is normalized to the intensity of the experimental spectrum at the m/z value corresponding to the most intense peak of the FP. 95% uncertainty bars are displayed in black.
Current usage metrics show cumulative count of Article Views (full-text article views including HTML views, PDF and ePub downloads, according to the available data) and Abstracts Views on Vision4Press platform.
Data correspond to usage on the plateform after 2015. The current usage metrics is available 48-96 hours after online publication and is updated daily on week days.
Initial download of the metrics may take a while.