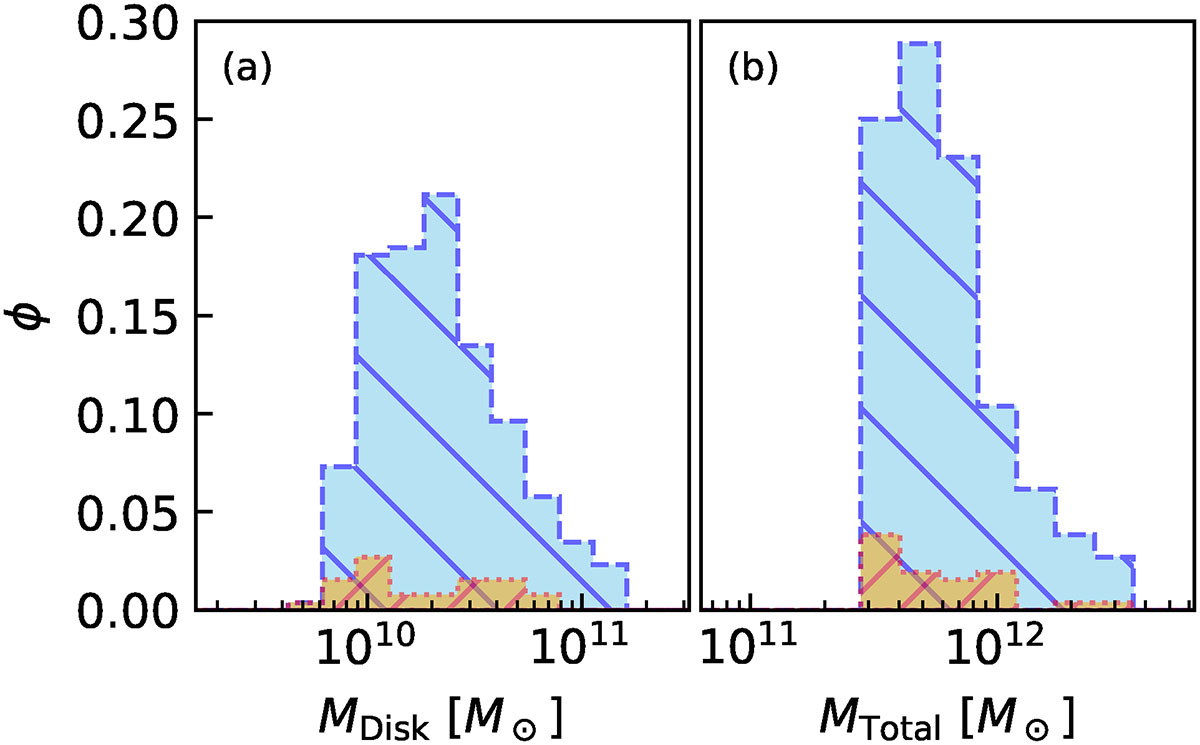
Fig. 1.
Download original image
Distributions of mass of the full sample of galaxies and the galaxies hosting a significant CRD. Panel (a): Distribution of stellar mass confined within the disk region, independent of the circularity parameter. Panel (b): Distribution of the total mass according to the Subfind algorithm (i.e., considering all particles bound to the galaxy). In both panels, the distribution was normalized according to the full sample of 260 galaxies, represented by the light blue shaded distribution. The orange shaded region represents the distribution of the 26 galaxies hosting a significant CRD component.
Current usage metrics show cumulative count of Article Views (full-text article views including HTML views, PDF and ePub downloads, according to the available data) and Abstracts Views on Vision4Press platform.
Data correspond to usage on the plateform after 2015. The current usage metrics is available 48-96 hours after online publication and is updated daily on week days.
Initial download of the metrics may take a while.