Fig. 9.
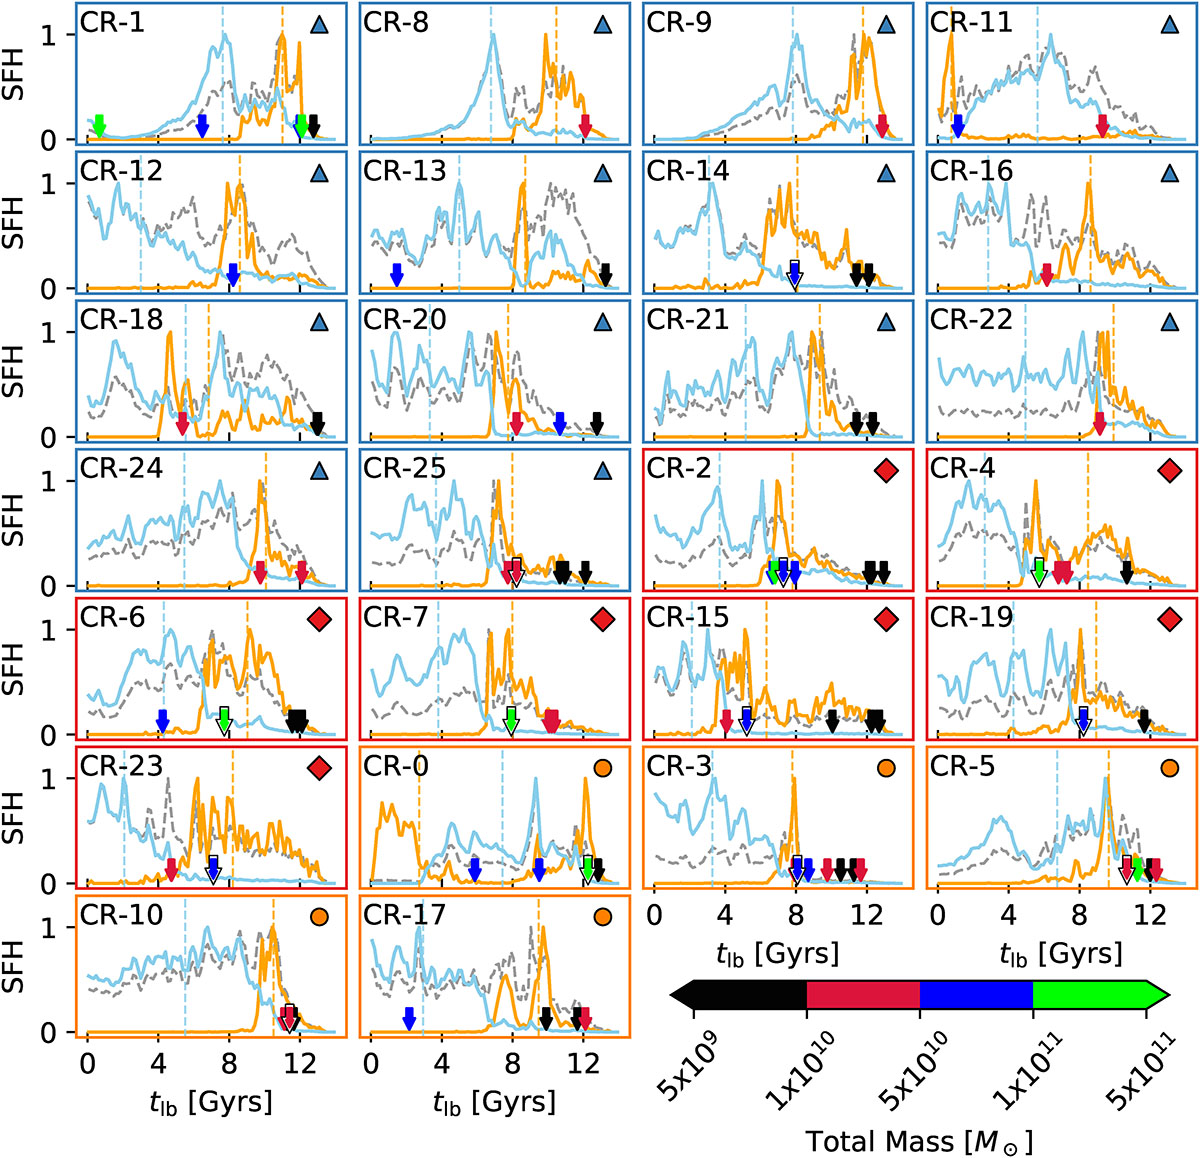
Download original image
Star formation histories of all 26 significant CRDs, grouped according to the classification type, namely, compact in situ, compact ex situ, and extended in situ (see Sect. 4). The orange and the light blue lines represent the SFH of the counterrotating and the corotating disk component, respectively. The vertical dashed lines indicate the median of each distribution. The gray line represents the SFH of all stellar particles confined within the disk region independent of their circularity parameter. All SFHs were normalized to the peak value of the corresponding distribution. For each CRD, we also label the time of the first pericenter for the most significant interactions experienced by the galaxy, considering only satellites with a peak total mass greater than 5 × 10⁹ M⊙ and a satellite-to-host mass-ratio greater than 20%. The most significant interaction of the CRD is identified by an arrow outlined in black and white.
Current usage metrics show cumulative count of Article Views (full-text article views including HTML views, PDF and ePub downloads, according to the available data) and Abstracts Views on Vision4Press platform.
Data correspond to usage on the plateform after 2015. The current usage metrics is available 48-96 hours after online publication and is updated daily on week days.
Initial download of the metrics may take a while.