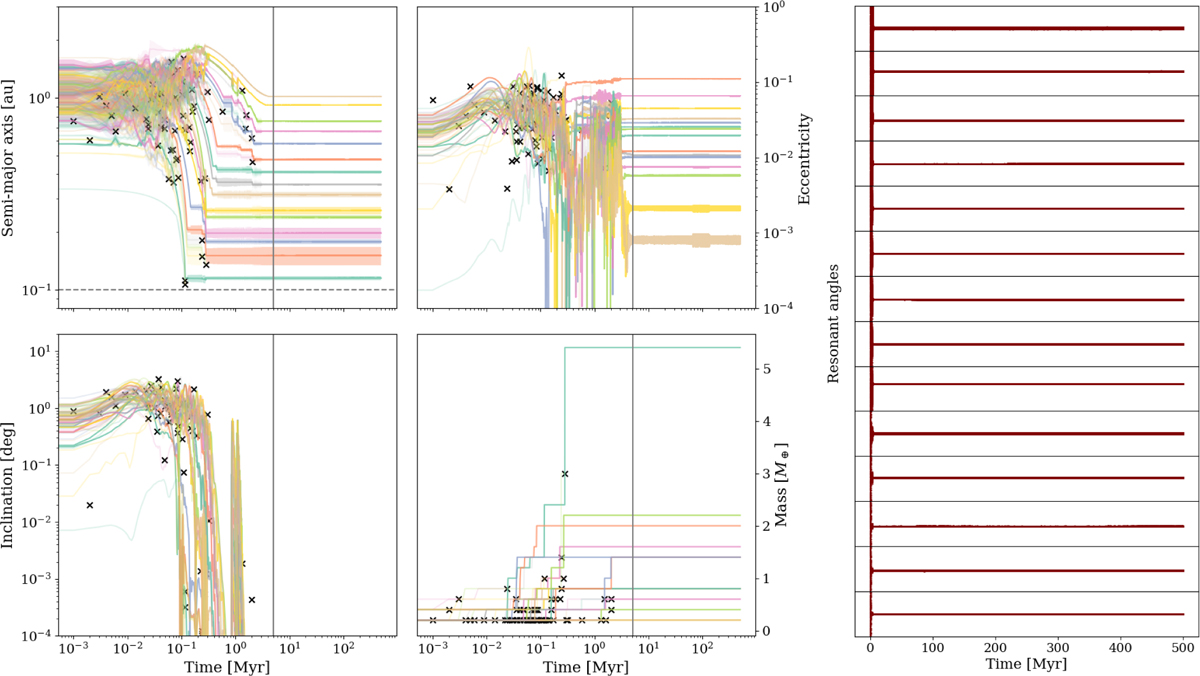
Fig. 12
Download original image
Example of a system from the 20straight suite that remained stable and in resonance for the entirety of the simulation. Left: evolution of the orbital elements and masses over time. Disk dissipation is marked by a vertical dashed line at 5.1 Myr. The horizontal dashed line in the top left panel marks the planet trap at 0.1 au representing the disk inner edge. Black Xs mark when planets were removed from the simulation after a collision and merger. Right: mean motion resonant angles of adjacent pairs of planets in the system from out to in, with resonances determined from the state of the system at the time of disk removal. The y-axis in each panel ranges from 0 to 2 π. All pairs remain in a low-amplitude librating resonant state from the time of disk dissipation to the end of the simulation.
Current usage metrics show cumulative count of Article Views (full-text article views including HTML views, PDF and ePub downloads, according to the available data) and Abstracts Views on Vision4Press platform.
Data correspond to usage on the plateform after 2015. The current usage metrics is available 48-96 hours after online publication and is updated daily on week days.
Initial download of the metrics may take a while.