Fig. 5
Download original image
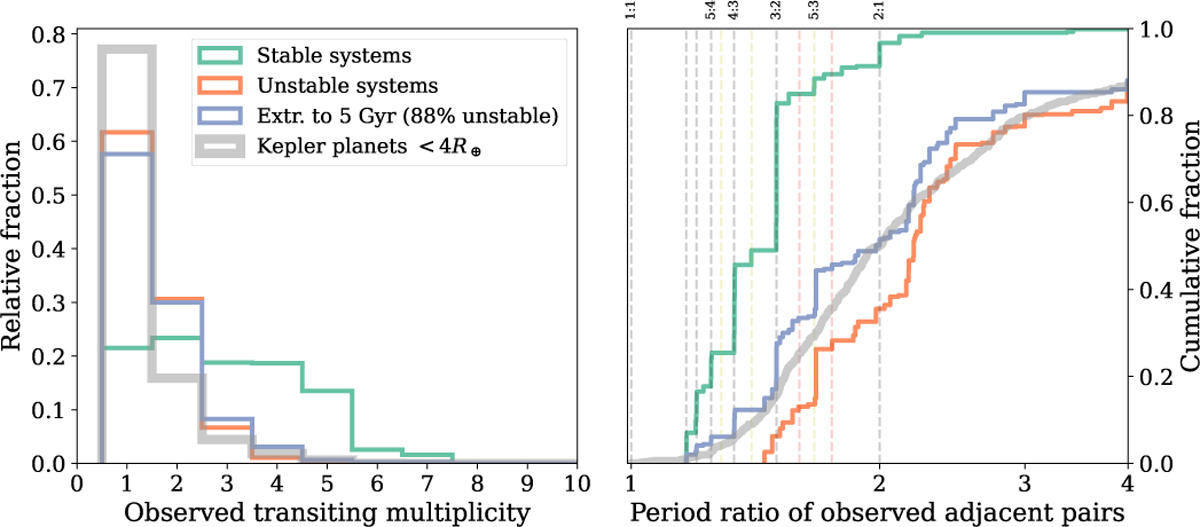
Distributions of transiting multiplicity and, for multitransiting systems, period ratio of adjacent planets, for the 20flat simulation suite. For each system, 1000 “observations” are taken along different lines-of-sight to determine which planets would be observed. The purple line is a set of planetary systems resampled from the original 20flat set such that 88% of them had a post-disk instability, corresponding to the extrapolated value of the Weibull distribution at t=5 Gyr (see text for details). Light gray lines are the observed Kepler population for systems where all transiting planets were smaller than 4 R⊕.
Current usage metrics show cumulative count of Article Views (full-text article views including HTML views, PDF and ePub downloads, according to the available data) and Abstracts Views on Vision4Press platform.
Data correspond to usage on the plateform after 2015. The current usage metrics is available 48-96 hours after online publication and is updated daily on week days.
Initial download of the metrics may take a while.