Fig. B.7.
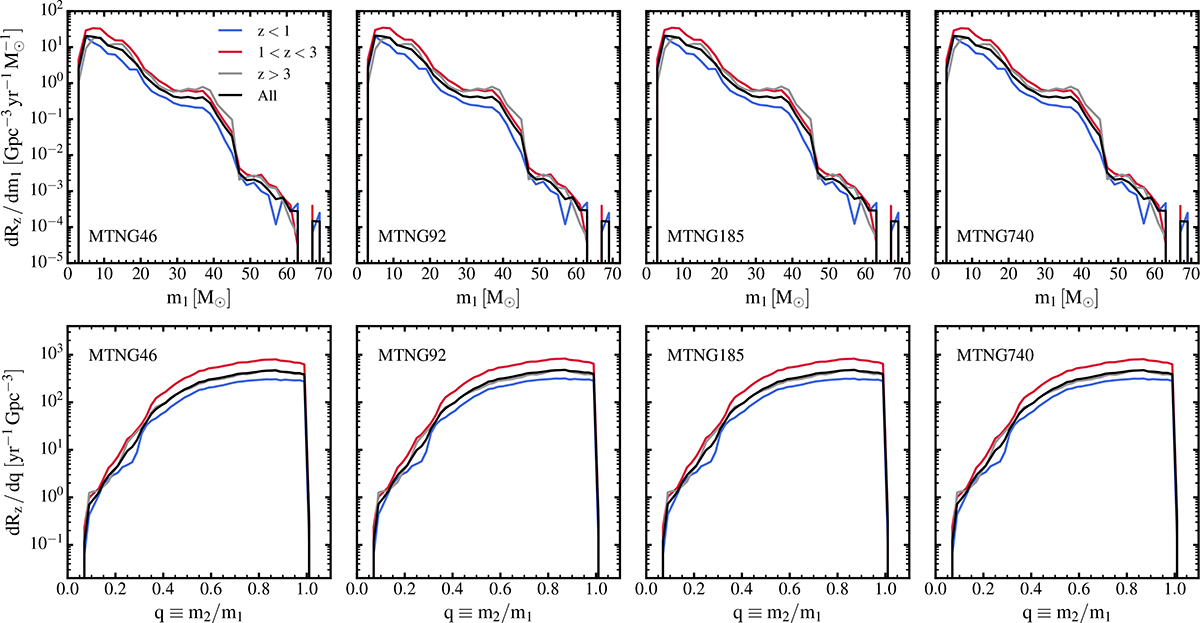
Download original image
Redshift evolution of differential merger rates of BBH merger GW progenitor events in four different boxes of the MTNG simulations: MTNG46, MTNG92, MTNG185, and MTNG740 (from left to right). Top: Distributions displayed as a function of the mass of the primary black hole (m1) of the merging compact binary systems. Bottom: Distributions in terms of mass ratio q ≡ m2/m1. Merger rates are normalized relative to the comoving volume of each simulation and to the time span (in gigayears) covered by the redshift intervals reported in the legend.
Current usage metrics show cumulative count of Article Views (full-text article views including HTML views, PDF and ePub downloads, according to the available data) and Abstracts Views on Vision4Press platform.
Data correspond to usage on the plateform after 2015. The current usage metrics is available 48-96 hours after online publication and is updated daily on week days.
Initial download of the metrics may take a while.