Open Access
Fig. 4.
Download original image
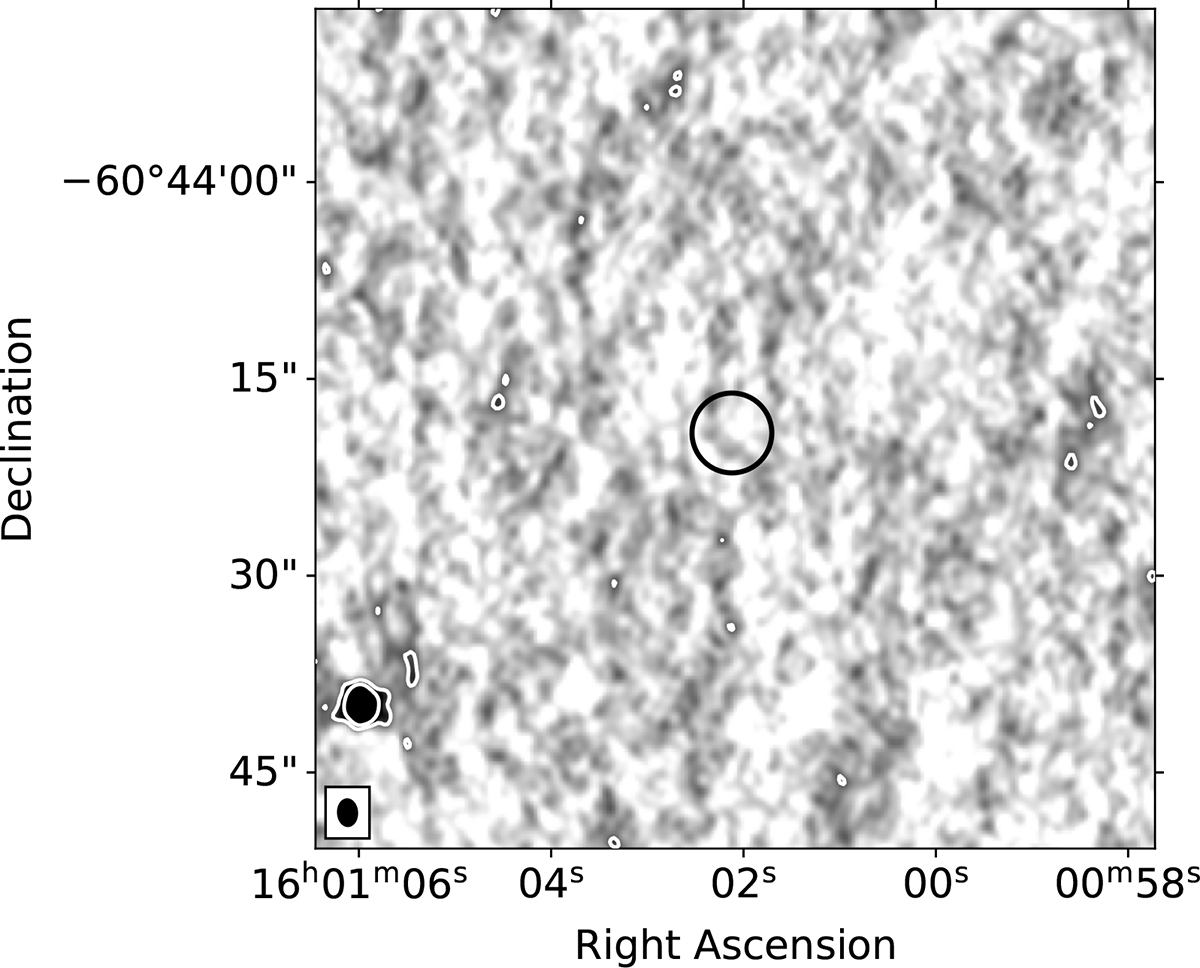
ATCA radio image of 4U 1556–60 at the combined frequency of 7.25 GHz. The black circle is centered on the Gaia optical counterpart for visual reference. The contours plotted are 3σ and 10σ, where σ is the background RMS value of 3.5 μJy. The bright source in the lower left corner has a peak flux density of 174 μJy (∼50σ).
Current usage metrics show cumulative count of Article Views (full-text article views including HTML views, PDF and ePub downloads, according to the available data) and Abstracts Views on Vision4Press platform.
Data correspond to usage on the plateform after 2015. The current usage metrics is available 48-96 hours after online publication and is updated daily on week days.
Initial download of the metrics may take a while.