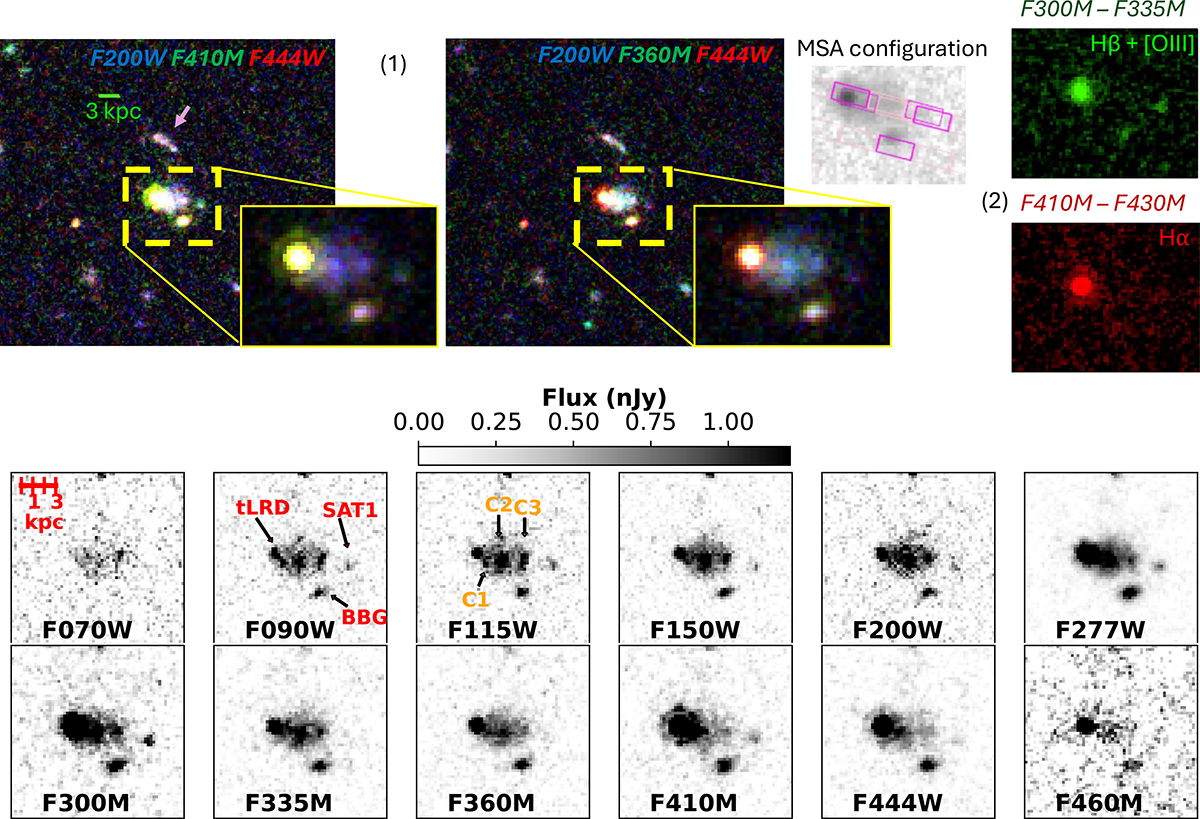
Fig. 1.
Download original image
Cutouts of the galaxy group in different bands. Top: (1) 7.7 × 7.1 arcsec2 cutouts of two RGB images based on F200W, F410M, and F444W (left) and F200W, F360M, and F444W (right), from NIRCam imaging not convolved to the F444W resolution. The yellow square encloses the region that contains the part of the Stingray studied in this work; its dimensions are 2.0 × 1.4 arcsec2. A view with a less saturated scale highlights the color differences among the galaxies. These images show the F410M excess in the tLRD (see panel 2), due to Hα emission at this redshift, relative to the continuum probed by F360M. The pink arrow in the left panel points to a z ∼ 1.5 galaxy group located ∼1.3″ from the tLRD that resembles the tail of the Stingray. We include a cutout showing the positions of the MSA slits. (2) Cutouts of F300M − F335M (top) and F410M − F430M (bottom) showing the Hβ plus OIII and Hα emission, respectively. Bottom: Postage stamps of the sources in different NIRCam bands, not convolved to the F444W resolution. All images are shown at the same scale.
Current usage metrics show cumulative count of Article Views (full-text article views including HTML views, PDF and ePub downloads, according to the available data) and Abstracts Views on Vision4Press platform.
Data correspond to usage on the plateform after 2015. The current usage metrics is available 48-96 hours after online publication and is updated daily on week days.
Initial download of the metrics may take a while.