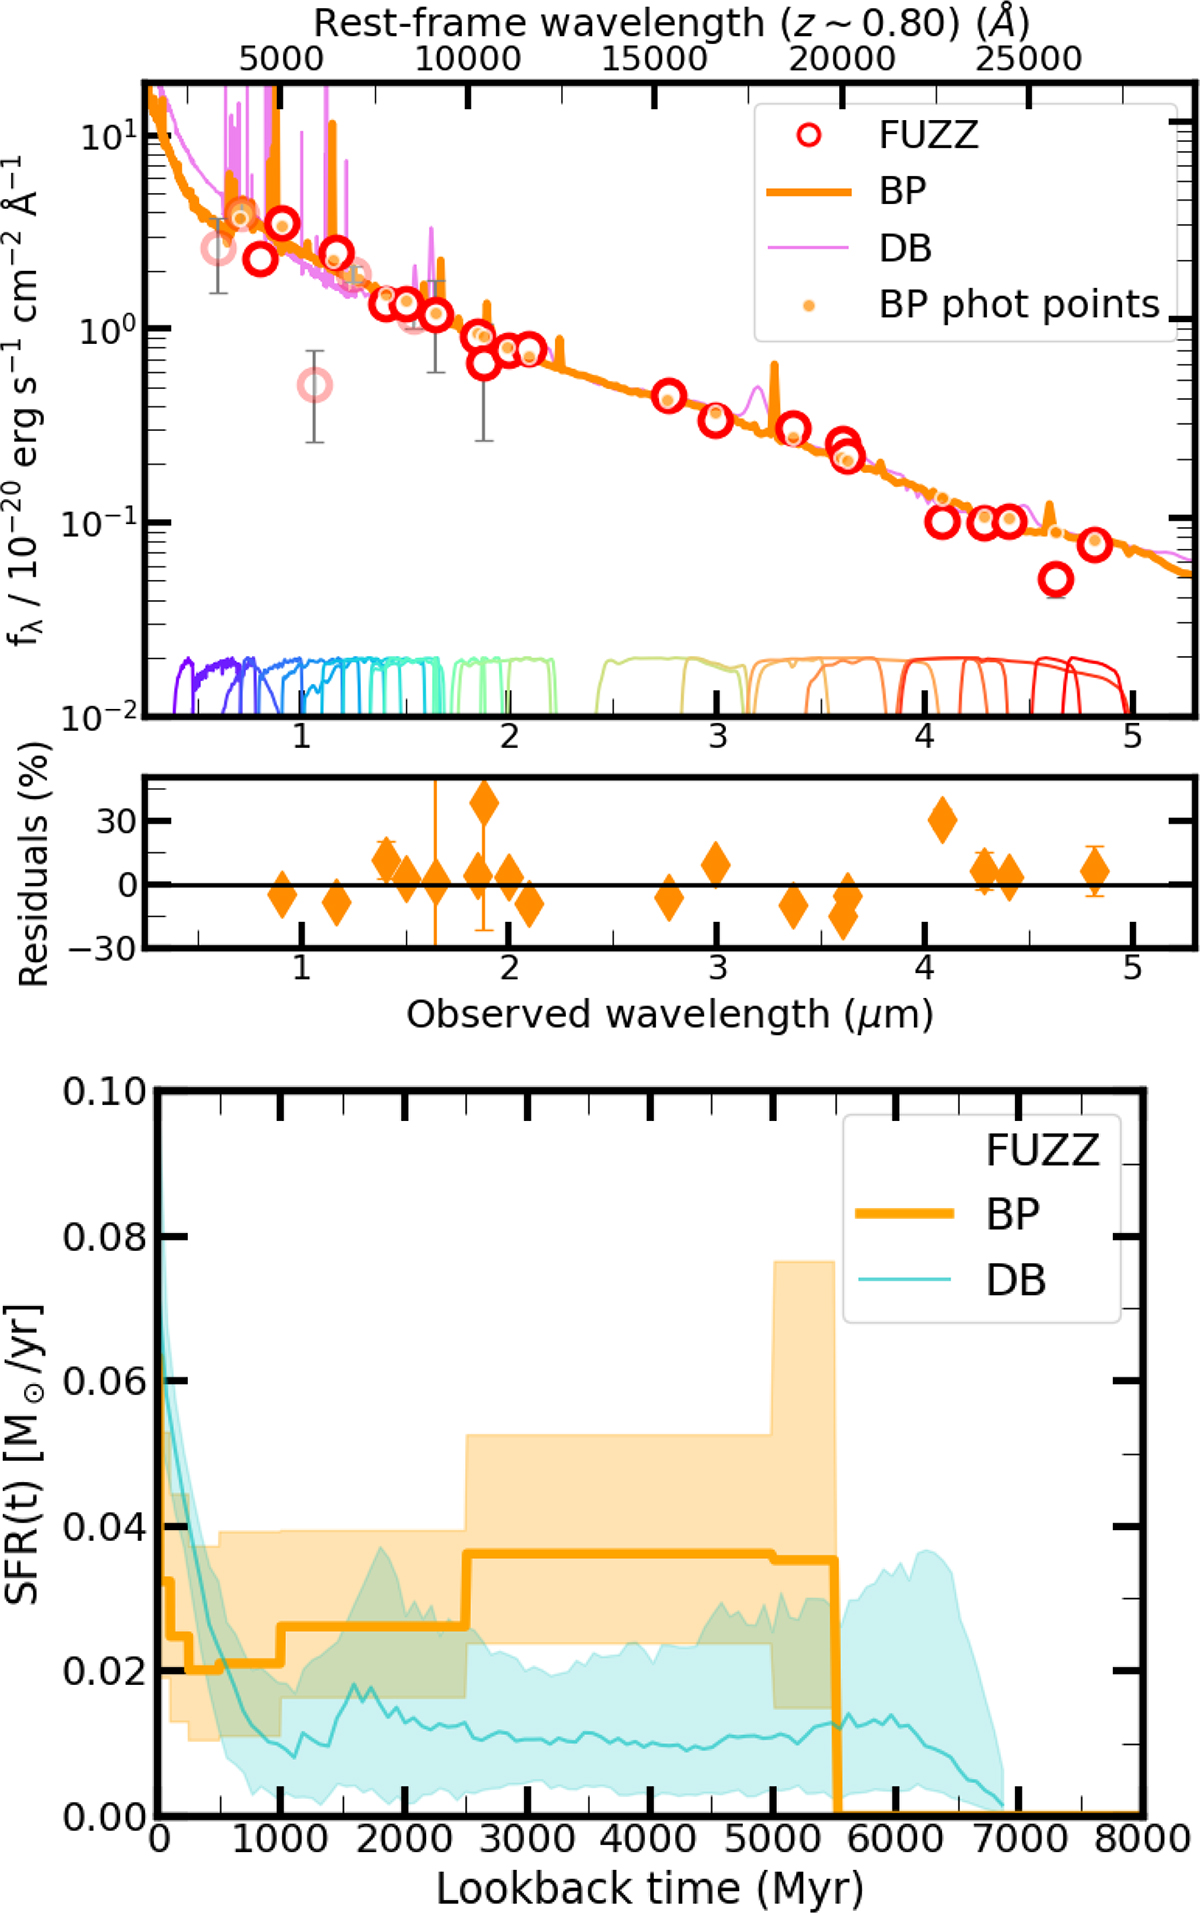
Fig. A.1.
Download original image
Top: photometry of the fuzzy emission (open red circles) and best-fitting models from Bagpipes and Dense Basis (in orange and violet). See Fig. 2 for a complete description of the markers and color codes used in this plot. Bottom: SFHs derived with Bagpipes (orange) and Dense Basis (cyan). The shaded regions correspond to the area enclosed within the 16th and 84th percentiles.
Current usage metrics show cumulative count of Article Views (full-text article views including HTML views, PDF and ePub downloads, according to the available data) and Abstracts Views on Vision4Press platform.
Data correspond to usage on the plateform after 2015. The current usage metrics is available 48-96 hours after online publication and is updated daily on week days.
Initial download of the metrics may take a while.