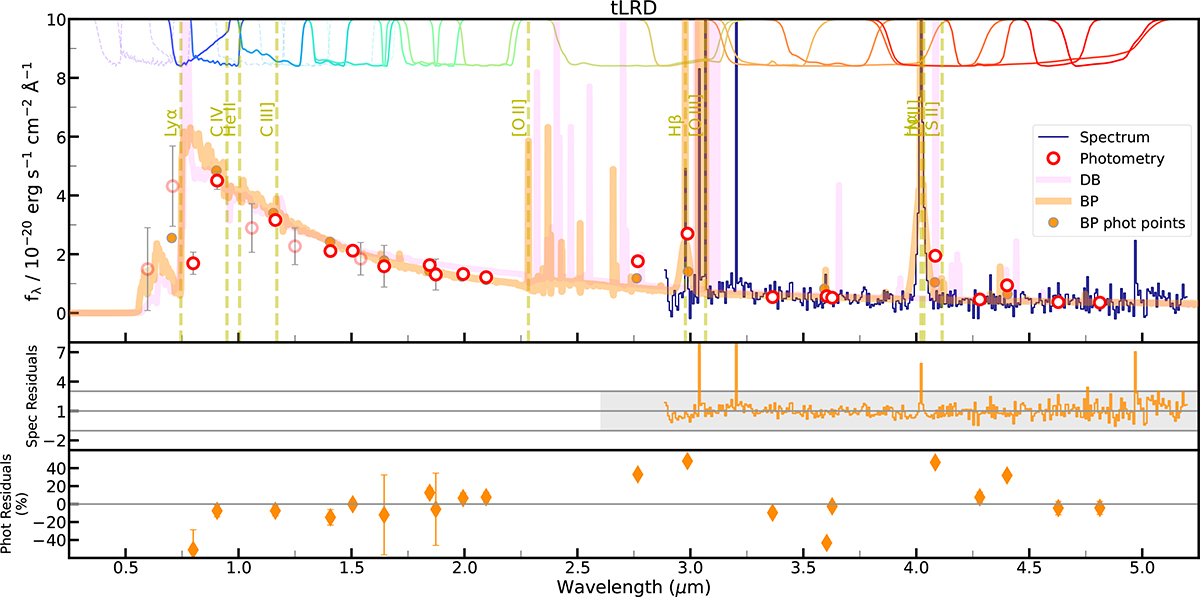
Fig. 2.
Download original image
G395M MSA spectra (blue) and photometry (open red circles) of the tLRD. The spectrum was rebinned in wavelength to improve S/N and readability. Lighter circles correspond to the HST photometry, which was not considered in our spectro-photometric analysis. The best-fitting models from Bagpipes (spectra plus photometry) and DenseBasis (photometry only) are shown in orange and pink respectively. The Dense Basis fit explored a broader range of redshifts, including the photo-z, to ensure convergence, which explains the slight offset between the lines in both models. The photometric points associated with the Bagpipes model are shown as orange circles. We include the ACS and WFC3/HST (dashed) and NIRCam/JWST (solid) filter transmission curves at the top of the panel. Vertical dashed lines highlight the position of the main emission lines at this redshift. We show the Bagpipes residuals underneath. For the spectrum, residuals are computed as the ratio between the spectrum and the model. The shaded gray region corresponds to one standard deviation. For the photometry, we display the difference between the photometry and the model weighted by the photometry. Uncertainties represent the inverse of the S/N. The spectrum dominates the fitting in the optical, resulting in larger residuals in the photometry.
Current usage metrics show cumulative count of Article Views (full-text article views including HTML views, PDF and ePub downloads, according to the available data) and Abstracts Views on Vision4Press platform.
Data correspond to usage on the plateform after 2015. The current usage metrics is available 48-96 hours after online publication and is updated daily on week days.
Initial download of the metrics may take a while.