Open Access
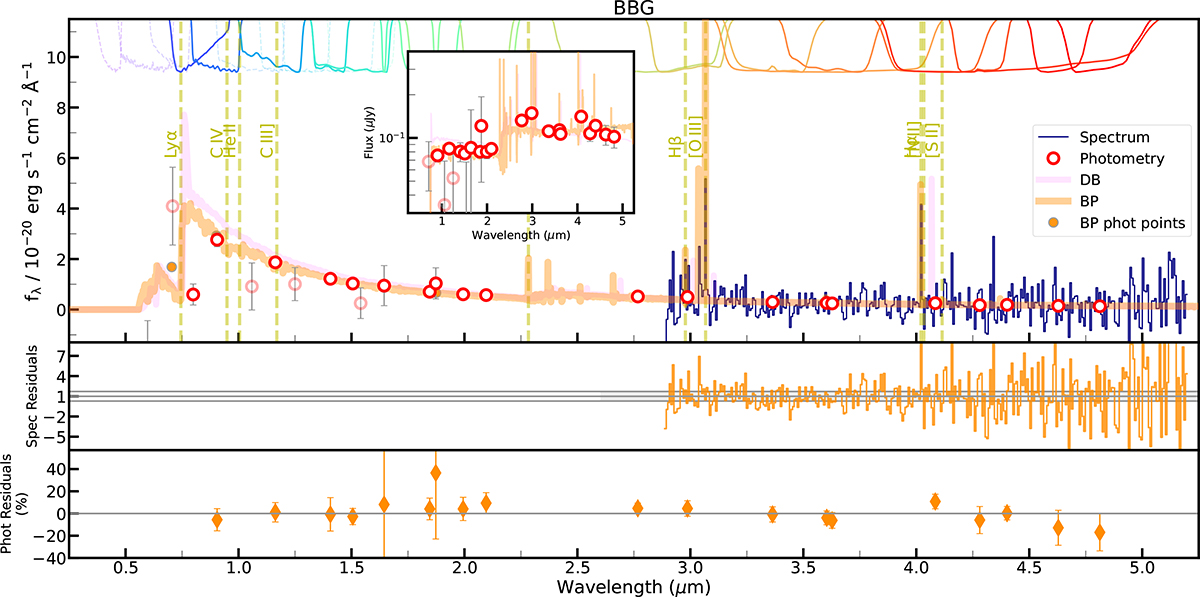
Fig. 3.
Download original image
G395M MSA spectra (blue) and photometry (open red circles) of the BBG. We include an inset with the photometry expressed in μJy where it is easier to spot the presence of the Balmer break. See Fig. 2 for a complete description of the markers and color codes used in this plot.
Current usage metrics show cumulative count of Article Views (full-text article views including HTML views, PDF and ePub downloads, according to the available data) and Abstracts Views on Vision4Press platform.
Data correspond to usage on the plateform after 2015. The current usage metrics is available 48-96 hours after online publication and is updated daily on week days.
Initial download of the metrics may take a while.